The Structure of the United States Code

United States Code (All Titles)

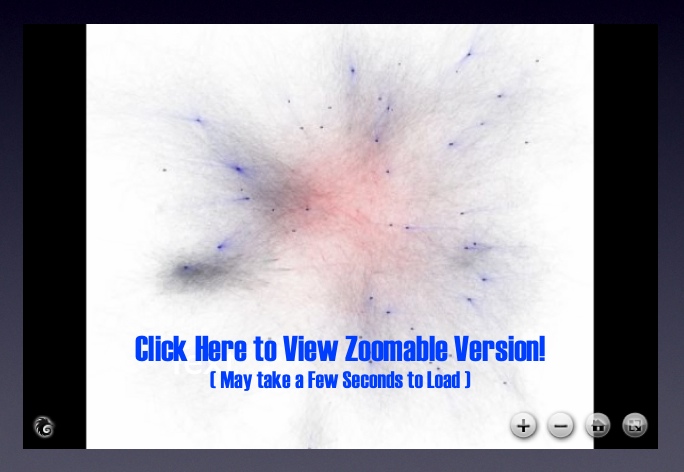
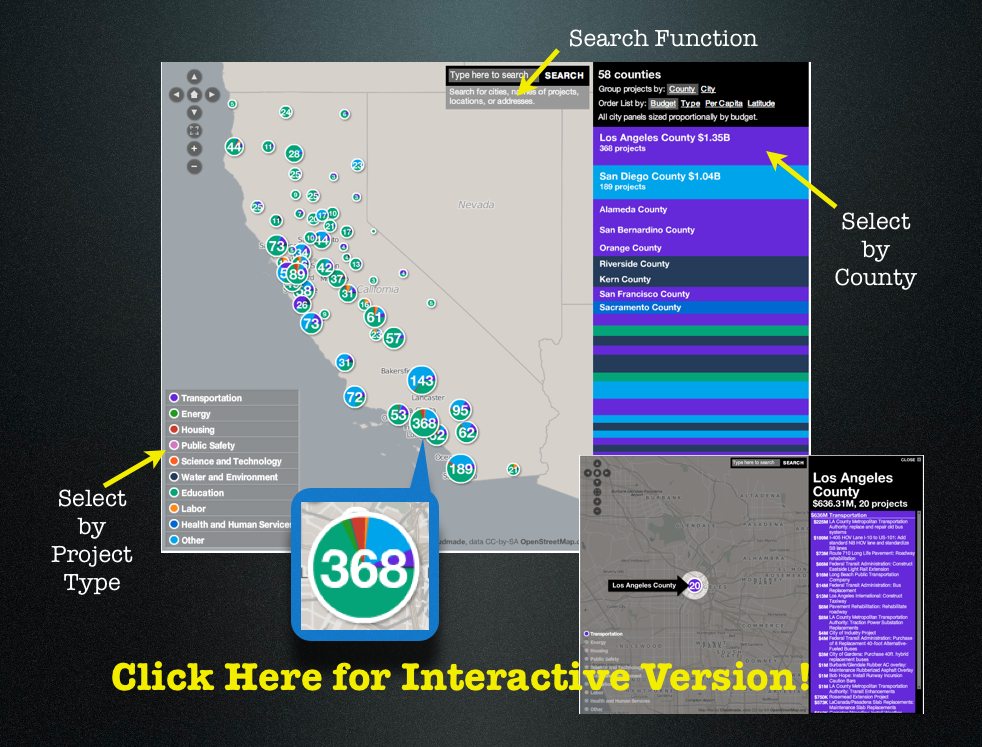
Formally organized into 50 titles, the United States Code is the repository for federal statutory law. While each of the 50 titles define a particular substantive domain, the structure within and across titles can be represent as a graph/network. In a series of prior posts, we offered visualizations at various “depths” for a number of well know U.S.C. titles. Click here and click Here for our two separate visualizations of the Tax Code (Title 26).  Click here for our visualization of the Bankruptcy Code (Title 11).  Click here for our visualization of Copyright (Title 17). While our prior efforts were devoted to displaying the structure of a given title of the US Code, the visualization above offers a complete view of the structure of the entire United States Code (Titles 1-50).

Using Seadragon from Microsoft Labs, each title is labeled with its respective number. The small black dots are “vertices” representing all sections in the aggregate US Code (~37,500 total sections). Given the size of the total undertaking, in the visual above, every title is represented to the “section level.”  As we described in earlier posts, a “section level” representation halts at the section and thus does not represent any of subsection depth.  For example, all sections under 26 U.S.C. § 501 including the well known § 501 (c) (3) are reattributed upward to their parent section.

There are two sources of structure within the United States Code. The explicitly defined structure / linkage / dependancy derives from the sections contained under a given title. The more nuanced version of structure is obtained from references or definitions contained within particular sections. This class of connections not only link sections within a given title but also connection sections across titles.  Within this above visual, we represent these important cross-title references by coloring them red.

Taken together, this full graph of the Untied States Code is quite large {i.e. directed graph (|V| = 37500, |E| = 197749)}. There exist 37,500 total sections distributed across the 50 Titles. However, these sections are not distributed in a uniform manner. For example, components such as Title 1 feature very few sections while Titles such as 26 and 42 contain many sections. The number of edges far outstrips the number of vertices with a total 197,000+ edges in the graph.

Picture 1 Seadragon has a number of nice features which enhance the experience of the end user. For example, a user can drag the image around by clicking and holding down the mouse button. Most importantly, is the symbol to the left. If you run your mouse over the above zoomable visual… look for this symbol to appear in the southeast corner.  Click on it and it will make the visual full size… as you will see… the full size visual makes for a far more compelling HCI

Special Social Networks Themed Issue of American Politics Research

American Politics Research

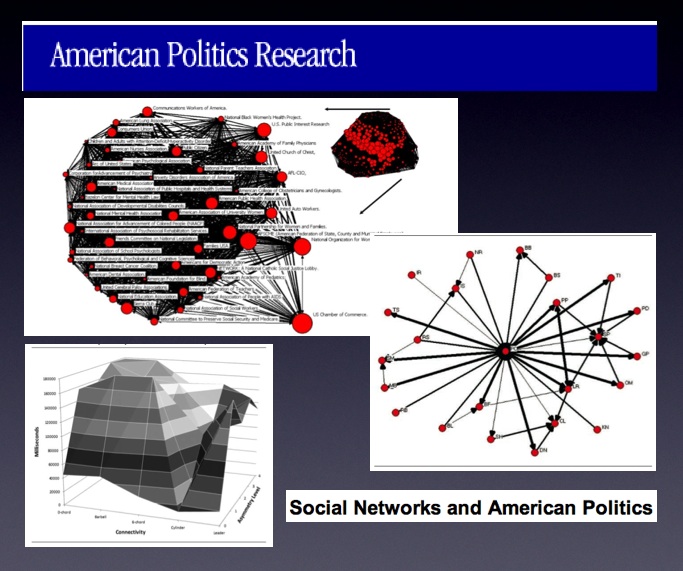
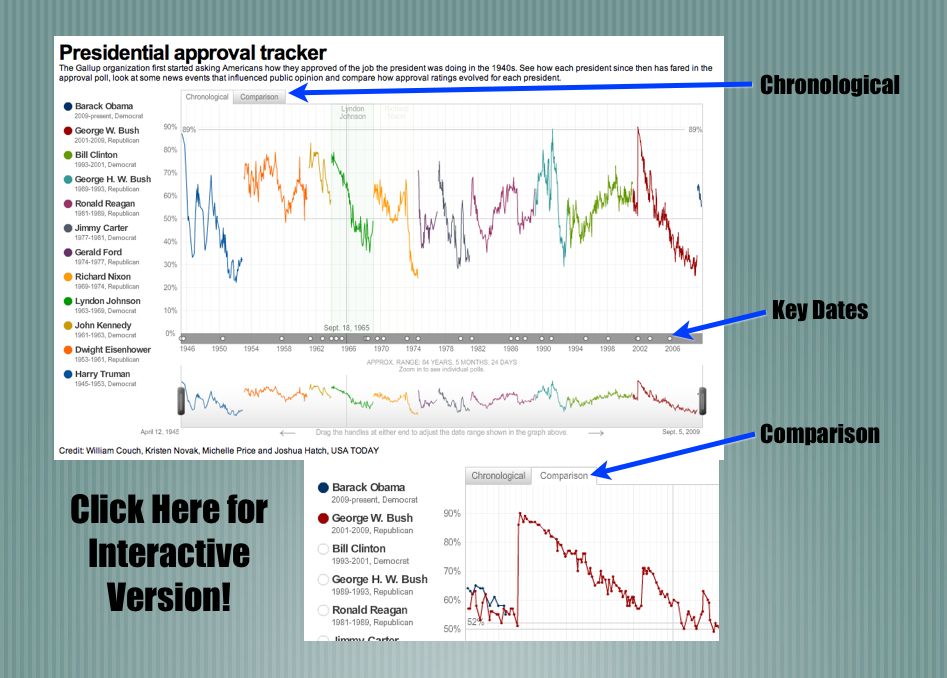
There are a number of high quality interdisciplinary research groups here at Michigan.  We are working with one of these groups — The Political Networks Lab. It is led by Michael Heaney (now here at Michigan in Organizational Studies). Michael is the author of numerous publications and was recently the guest editor of a special issue of American Politics Research. We wanted to highlight this recent issue as there are a number of articles that might be of interest.  Click above to view the contents!

The Law Clerkship Tournament : The Expanded Edition [Repost from 8/3]

 Clerkships

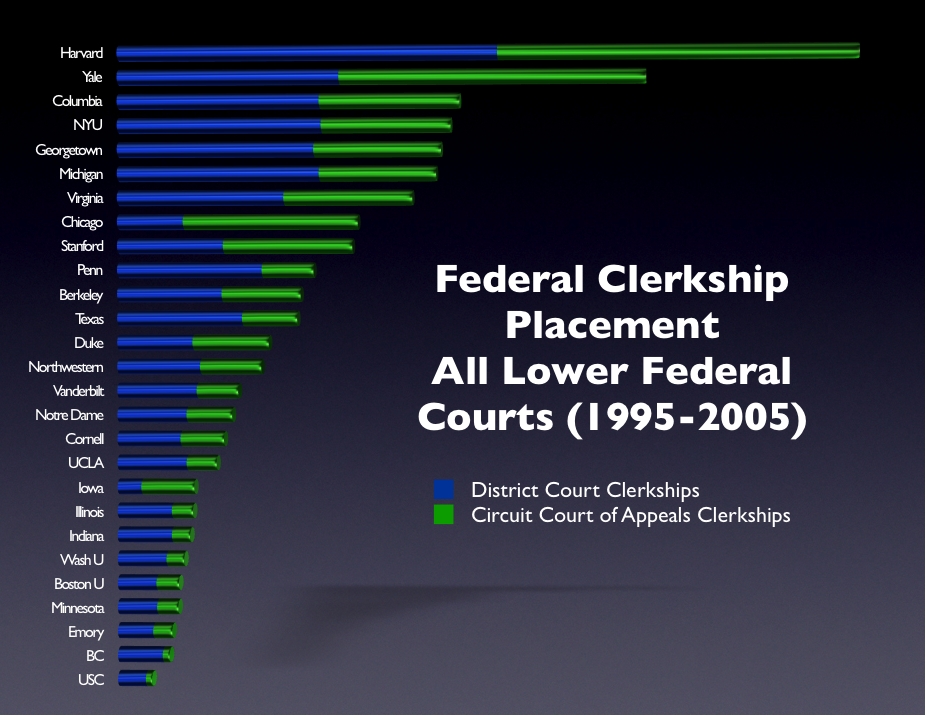
Our multipart series on the clerkship tournament continues above with an expanded edition of our underlying dataset.  It is important to note that we do not threshold for the number of graduates per school. Specifically, we do not just divide by the number graduates per school because we do not have any particular theoretic reason to believe that placements linearly scale to differences in size of graduating classes. In other words, given we do not know the proper functional form — we just offer the raw data for your consideration. For those interested in other posts, please click here for the law clerks tag. 

In the previous circuit/district post, we focused upon the “top” 15 schools as ranked by an older version of US News.  When we expand the analysis to consider a wider slice of institutions, two schools standout — Texas and Notre Dame.  Basically, the arbitrariness of the prior cut off we imposed did not really do justice to these institutions … this wider view provides a deeper indication of their standing relative to other institutions.  

The Dynamics of Deterrence – New Article in PNAS

PNAS 08.25.09

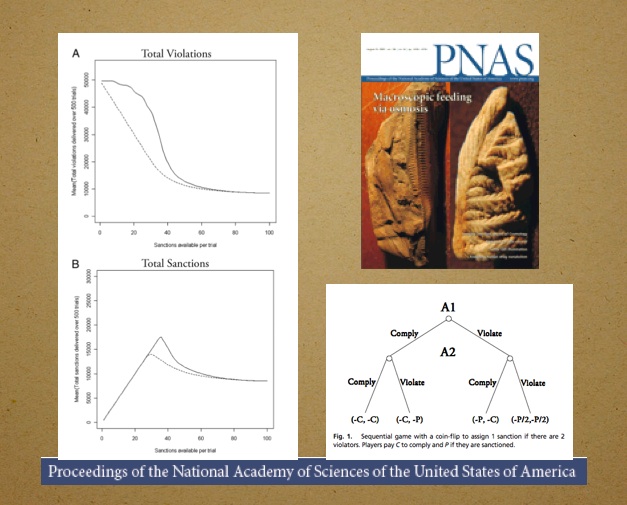
The latest edition of the Proceedings of the National Academy of Science (PNAS) features The Dynamics of Deterrence by Mark Kleiman & Beau Kilmer.  Here is the abstract:  “Because punishment is scarce, costly, and painful, optimal enforcement strategies will minimize the amount of actual punishment required to effectuate deterrence. If potential offenders are sufficiently deterrable, increasing the conditional probability of punishment (given violation) can reduce the amount of punishment actually inflicted, by “tipping” a situation from its high-violation equilibrium to its low-violation equilibrium. Compared to random or “equal opportunity” enforcement, dynamically concentrated sanctions can reduce the punishment level necessary to tip the system, especially if preceded by warnings. Game theory and some simple and robust Monte Carlo simulations demonstrate these results, which, in addition to their potential for reducing crime and incarceration, may have implications for both management and regulation.”

Real Time Visualization of US Patent Data [Via Infosthetics]

Patent Data Visualization

Using data dating back to 2005 and updating weekly using information from data.gov the Typologies of Intellectual Property project created by information designer Richard Vijgen offers almost real time visualization of US Patent Data.

From the documentation … “[T]ypologies of intellectual property is an interactive visualization of patent data issued by the United States Patent and Trademark Office.  Every week an xml file with about 3000 new patents is published by the USTPO and made available through data.gov.  This webapplication provides a way to navigate, explore and discover the complex and interconnected world of idea, inventions and big business.”

Once you click through please note to adjust the date in the upper right corner to observe earlier time periods.  Also, for additional information and/or documentation click the “about this site” in the upper right corner.  Enjoy!

Positive Legal Theory and a Model of Intellectual Diffusion on the American Legal Academy [Repost from 4/22]

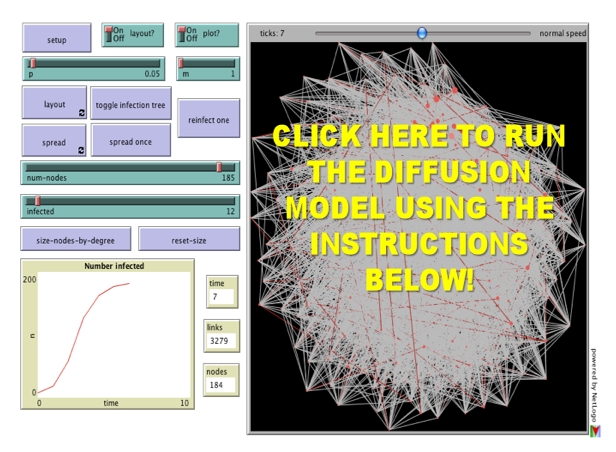
For the third installment of posts related to Reproduction of Hierarchy? A Social Network Analysis of the American Law Professoriate, we offer a Netlogo simulation of intellectual diffusion on the network we previously visualized.  As noted in prior posts, we are interested legal socialization and its role in considering the spread of particular intellectual or doctrinal paradigms. This model captures a discrete run of the social epidemiological model we offer in the paper.   As we noted within the paper, this represents a first cut on the question—where we favor parsimony over complexity.  In reality, there obviously exist far more dynamics than we engage herein.  The purpose of this exercise is simply to begin to engage the question. In our estimation, a positive theory of law should engage the sociology of the academy — a group who collectively socialize nearly every lawyer and judge in the United States. In the paper and in the model documentation, we offer some possible model extensions which could be considered in future scholarship.

Once you click through to the model, here is how it works:

(1) Click the Setup Button in the Upper Left Corner.  This will Display the Network in the Circular Layout.

(2) Click the Layout Button.  Depending upon the speed of your machine this may take up to 30 seconds.  Stop the Layout Button by Re-Clicking the Button.

(3) Click the Size Nodes by Degree Button. You Will Notice the Fairly Central Node Colored in Red.  This is School #12 Northwestern University Law School.  Observe how we have set the default infected school as #12 Northwestern (Hat Tip to Uri Wilensky).  A Full List of School Number is available at the bottom of the page when you click through.

(4) Now, we are ready to begin.  Click the Spread Once Button.  The idea then reaches its neighbors with probability p (set as a default at .05).  You can click the Toggle Infection Tree button (at any point) to observe the discrete paths traversed by the idea.

(5) Click the Spread Once Button, again and again.  Notice the plot tracking the time on the x axisand the number of institution infected on the y axis.  This is an estimate of the diffusion curve for the institution.

(6) To restart the simulation, click the Reinfect One button.  Prior to hitting this button, slide theInfected Slider to any Law School you would like to observe.  Also, feel free to adjust the p slider to increase or decrease the infectiousness of the idea.

Please comment if you have any difficulty or questions.  Note you must have Java 1.4.1 + installed on your computer.  The Information Technology professionals at many institutions will have already installed this on your machine but if not you will need to download it.   We hope you enjoy!

Forest Fire Model-A Popular Example of Non-Linearity [Repost from 5/13]

Forest Fire Model

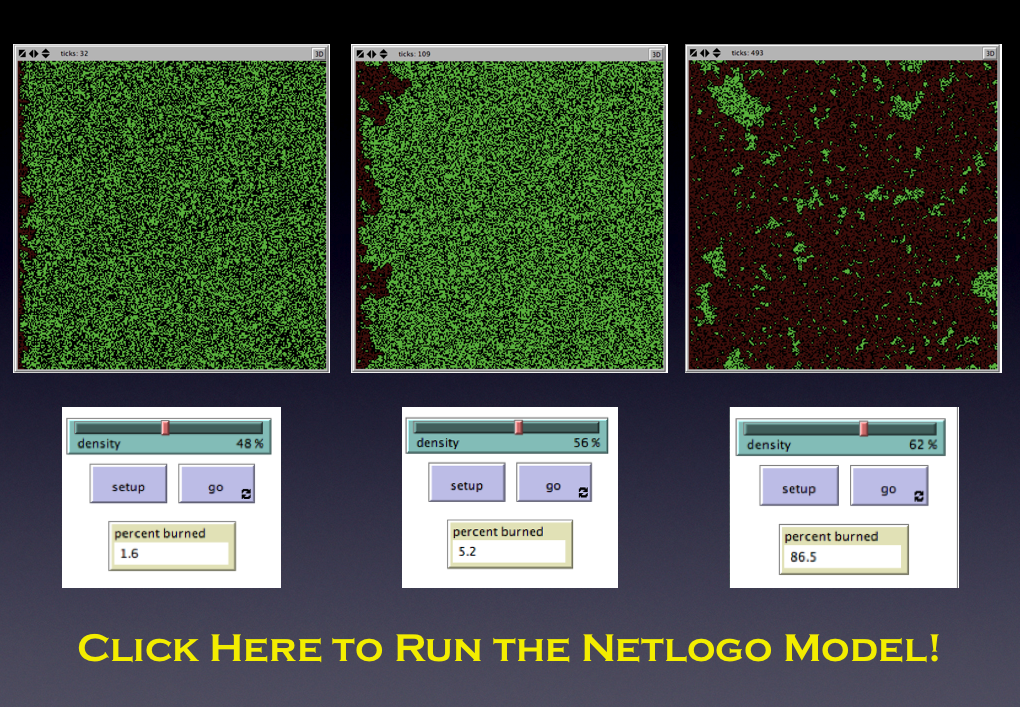
The Forest Fire Model is a commonly invoked example of non-linear system–where a very small perturbation can generate significant differences in observed outcomes. Consider the above Netlogo–to Run the Model: (1) Adjust the Density Slider to set the concentration within the Forest.  (2) Hit the Setup Button (3) Hit the Go Button  …. Rinse and Repeat at different levels of Density.

Above is the output for a run of the model at several levels of Density {48%, 56%, 62%}.  Notice the differences in the Percent Burned {1.6%, 5.2%, 86.5%}.

This is obviously a theoretical model but it has potential application to a wide class of substantive questions including regulatory failure.  In addition, the Forest Fire Model is important because it has been invoked in the critique of the popular book The Tipping Point. Specifically, in discussing the book network scientist Duncan Watts notes “It sort of sounds cool … But it’s wonderfully persuasive only for as long as you don’t think about it.” Watts notes “…trends are more like forest fires: There are thousands a year, but only a few become roaring monsters. That’s because in those rare situations, the landscape was ripe: sparse rain, dry woods, badly equipped fire departments. If these conditions exist, any old match will do…. and nobody… will go around talking about the exceptional properties of the spark that started the fire.” (Quotes from Jan 2008 Is the Tipping Point Toast? Fast Company Magazine).