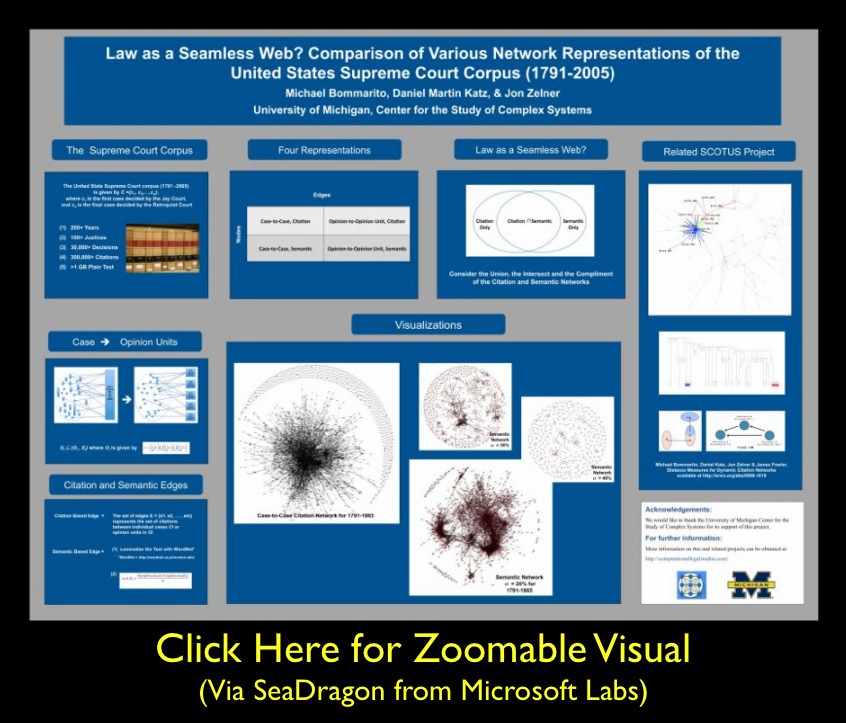
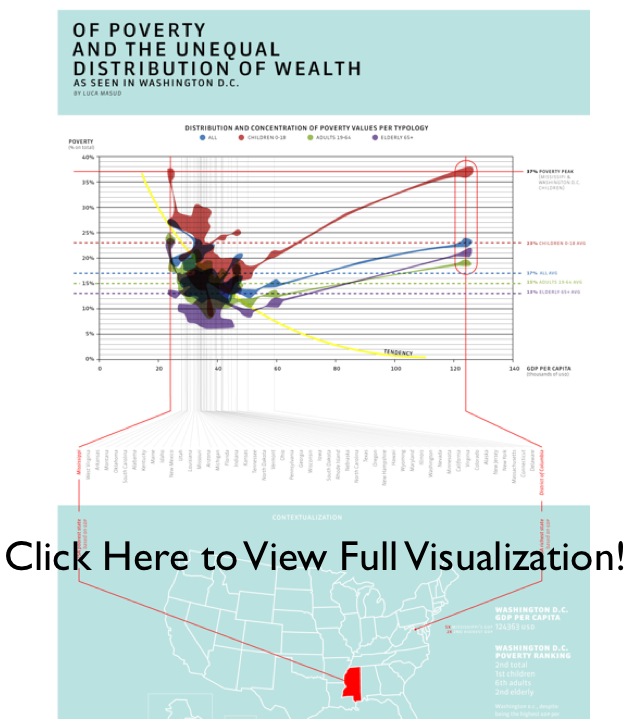
As we mentioned in previous posts, Seadragon is a really cool product. Please note load times may vary depending upon your specific machine configuration as well as the strength of your internet connection. For those not familiar with how to operate it please see below. In our view, the Full Screen is best the way to go ….
Author: clsadmin
The Structure of the United States Code [With Zoomorama]
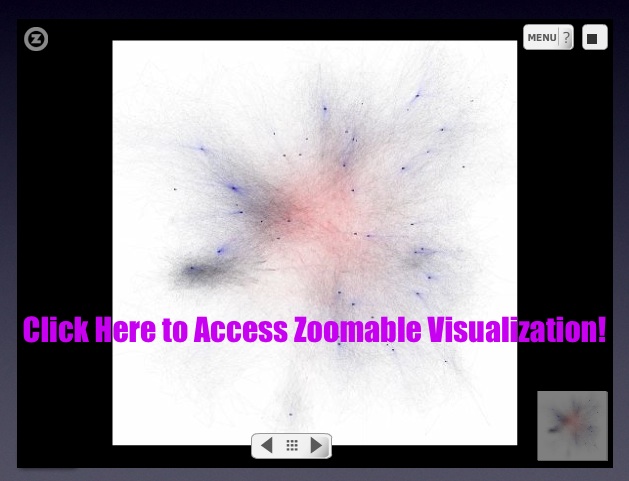
Above we offer the same visual of the United States Code (Titles 1-50) which we previously offered here … this time we are using Zoomorama. Zoomorama is an alternative to Seadragon which we believe might perform better on certain machine configurations.
Essentially, we do not want people to miss out on the visualization simply because their computer does not feature the necessary software/plugins. While some class of endusers still might not be able to view either version, we hope this alternative version will maximize the chances that it would be visable.
So, feel free to scroll over the visual using your mouse. For optimal viewing, however, we believe the full screen visual is the best way to go. Click on the square icon in the upper lright corner to make the visual full size. Click Here for the Zoomorama Instructions!
The Structure of the United States Code
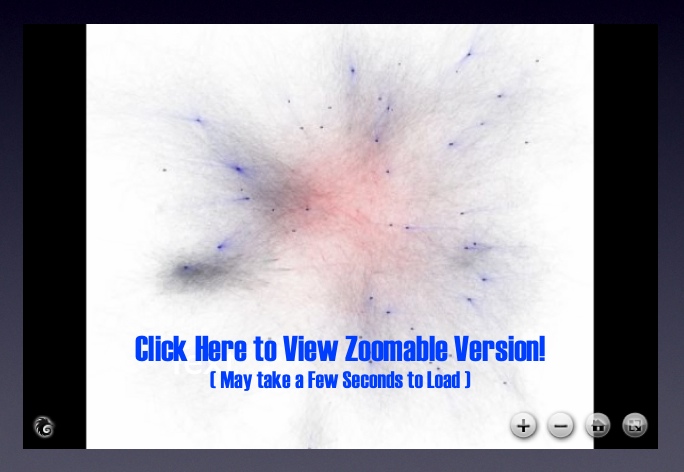
Formally organized into 50 titles, the United States Code is the repository for federal statutory law. While each of the 50 titles define a particular substantive domain, the structure within and across titles can be represent as a graph/network. In a series of prior posts, we offered visualizations at various “depths” for a number of well know U.S.C. titles. Click here and click Here for our two separate visualizations of the Tax Code (Title 26). Click here for our visualization of the Bankruptcy Code (Title 11). Click here for our visualization of Copyright (Title 17). While our prior efforts were devoted to displaying the structure of a given title of the US Code, the visualization above offers a complete view of the structure of the entire United States Code (Titles 1-50).
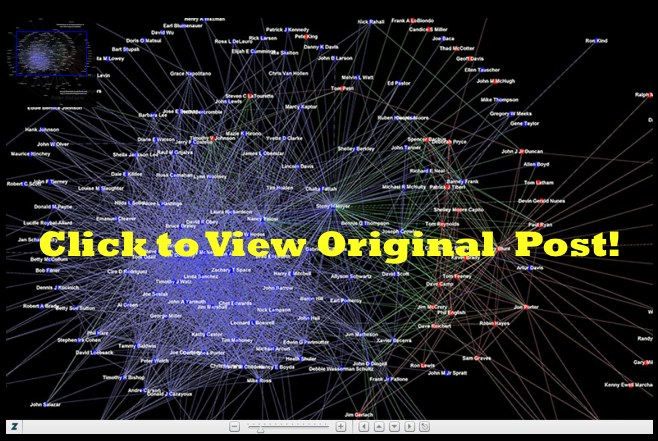
Using Seadragon from Microsoft Labs, each title is labeled with its respective number. The small black dots are “vertices” representing all sections in the aggregate US Code (~37,500 total sections). Given the size of the total undertaking, in the visual above, every title is represented to the “section level.” As we described in earlier posts, a “section level” representation halts at the section and thus does not represent any of subsection depth. For example, all sections under 26 U.S.C. § 501 including the well known § 501 (c) (3) are reattributed upward to their parent section.
There are two sources of structure within the United States Code. The explicitly defined structure / linkage / dependancy derives from the sections contained under a given title. The more nuanced version of structure is obtained from references or definitions contained within particular sections. This class of connections not only link sections within a given title but also connection sections across titles. Within this above visual, we represent these important cross-title references by coloring them red.
Taken together, this full graph of the Untied States Code is quite large {i.e. directed graph (|V| = 37500, |E| = 197749)}. There exist 37,500 total sections distributed across the 50 Titles. However, these sections are not distributed in a uniform manner. For example, components such as Title 1 feature very few sections while Titles such as 26 and 42 contain many sections. The number of edges far outstrips the number of vertices with a total 197,000+ edges in the graph.
 Seadragon has a number of nice features which enhance the experience of the end user. For example, a user can drag the image around by clicking and holding down the mouse button. Most importantly, is the symbol to the left. If you run your mouse over the above zoomable visual… look for this symbol to appear in the southeast corner. Click on it and it will make the visual full size… as you will see… the full size visual makes for a far more compelling HCI…
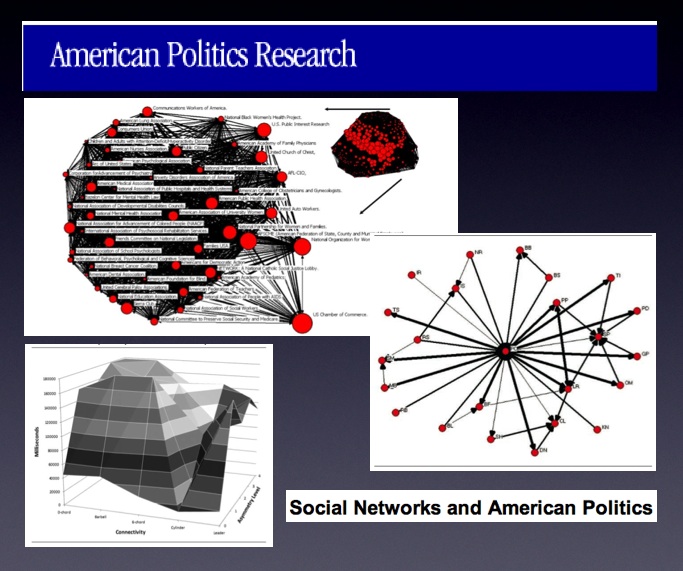
Special Social Networks Themed Issue of American Politics Research
There are a number of high quality interdisciplinary research groups here at Michigan. We are working with one of these groups — The Political Networks Lab. It is led by Michael Heaney (now here at Michigan in Organizational Studies). Michael is the author of numerous publications and was recently the guest editor of a special issue of American Politics Research. We wanted to highlight this recent issue as there are a number of articles that might be of interest. Click above to view the contents!
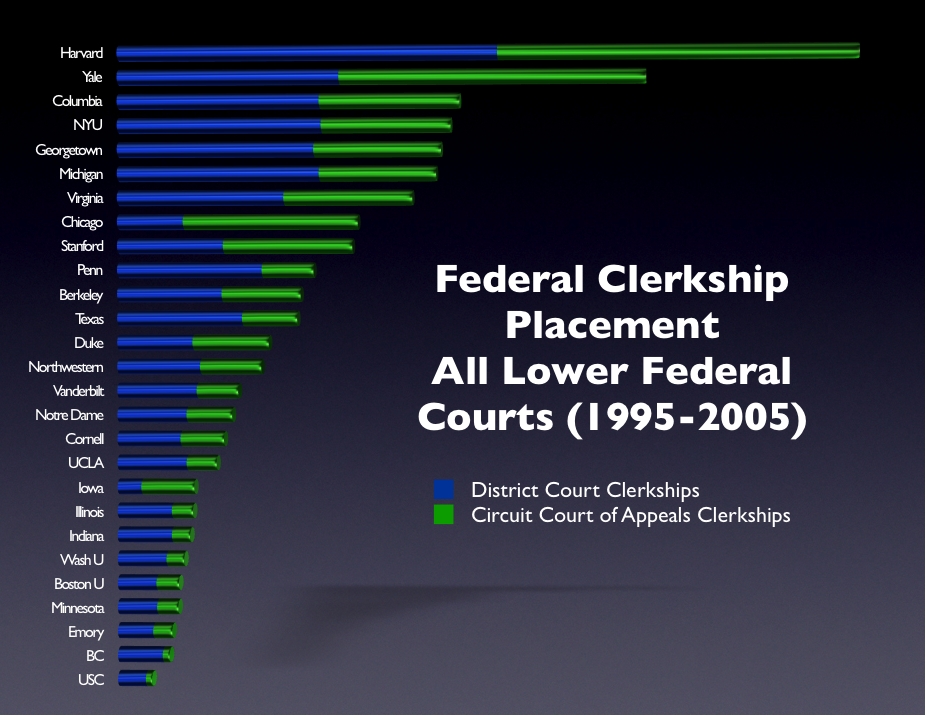
The Law Clerkship Tournament : The Expanded Edition [Repost from 8/3]
Our multipart series on the clerkship tournament continues above with an expanded edition of our underlying dataset. It is important to note that we do not threshold for the number of graduates per school. Specifically, we do not just divide by the number graduates per school because we do not have any particular theoretic reason to believe that placements linearly scale to differences in size of graduating classes. In other words, given we do not know the proper functional form — we just offer the raw data for your consideration. For those interested in other posts, please click here for the law clerks tag.
In the previous circuit/district post, we focused upon the “top” 15 schools as ranked by an older version of US News. When we expand the analysis to consider a wider slice of institutions, two schools standout — Texas and Notre Dame. Basically, the arbitrariness of the prior cut off we imposed did not really do justice to these institutions … this wider view provides a deeper indication of their standing relative to other institutions.
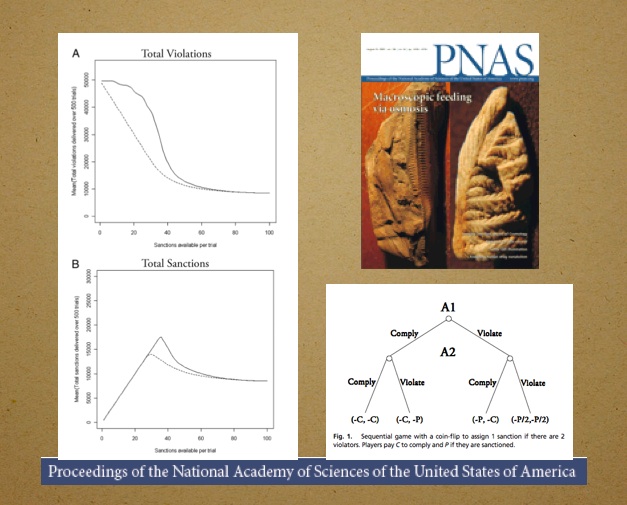
The Dynamics of Deterrence – New Article in PNAS
The latest edition of the Proceedings of the National Academy of Science (PNAS) features The Dynamics of Deterrence by Mark Kleiman & Beau Kilmer. Here is the abstract: “Because punishment is scarce, costly, and painful, optimal enforcement strategies will minimize the amount of actual punishment required to effectuate deterrence. If potential offenders are sufficiently deterrable, increasing the conditional probability of punishment (given violation) can reduce the amount of punishment actually inflicted, by “tipping” a situation from its high-violation equilibrium to its low-violation equilibrium. Compared to random or “equal opportunity” enforcement, dynamically concentrated sanctions can reduce the punishment level necessary to tip the system, especially if preceded by warnings. Game theory and some simple and robust Monte Carlo simulations demonstrate these results, which, in addition to their potential for reducing crime and incarceration, may have implications for both management and regulation.”
Real Time Visualization of US Patent Data [Via Infosthetics]
Using data dating back to 2005 and updating weekly using information from data.gov the Typologies of Intellectual Property project created by information designer Richard Vijgen offers almost real time visualization of US Patent Data.
From the documentation … “[T]ypologies of intellectual property is an interactive visualization of patent data issued by the United States Patent and Trademark Office. Every week an xml file with about 3000 new patents is published by the USTPO and made available through data.gov. This webapplication provides a way to navigate, explore and discover the complex and interconnected world of idea, inventions and big business.”
Once you click through please note to adjust the date in the upper right corner to observe earlier time periods. Also, for additional information and/or documentation click the “about this site” in the upper right corner. Enjoy!

