A Rational But Ultimately Unsuccessful Critique of Nate Silver

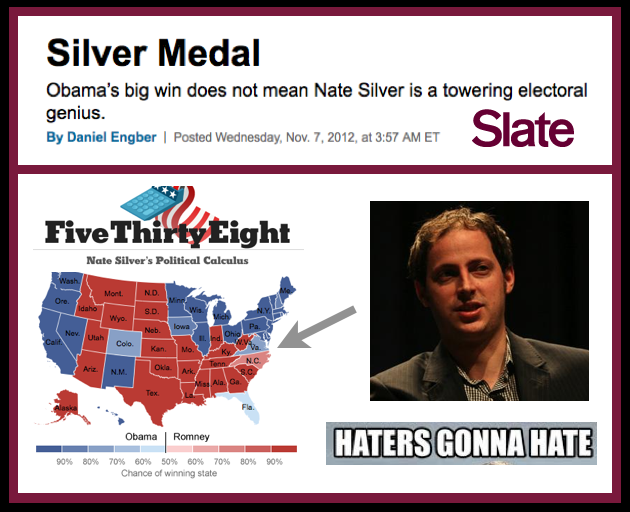
This article is reasonable in so much as it is a rational argument against Nate Silver’s work at 538 (rather than the ridiculous nonsense he had to endure from folks who are totally clueless – UnSkewedPolls.com, etc.).  However, it is ultimately unsuccessful.

“Nate Silver didn’t nail it; the pollsters did.”  Not true.  They both got it correct (or as accurate as can be when there is only 1 event that is being modeled).

“To be fair, the art of averaging isn’t simple.”  Well it is not just averaging.  Pure averaging is totally stupid.  This is weighting and it is non-trivial because you need to build a notion of how much signal vs. noise to assign to each {pollster, time point combo}.  Some of these polling outfits are totally disreputable and some have historic “house effects” (see e.g. Rasmussen).  With respect to time – the question is how much of the past is useful for predicting the future – so you need some sort of decay function to phase out the impact of prior data points (prior polls) on your current prediction.

It is correct to say that Nate Silver’s model cannot be validated in a traditional sense – he uses simulation – because on every day other than election day – there is no way to execute a direct test of the accuracy of the model.  Simulation is basically as good as we can do in an environment where there is only one event and it is perfectly valid as a scientific endeavor.  If folks want to complain and actually be taken seriously – they can come up with their own positive approach.  The scientific community can engage the competing claims.  For example, the Princeton Election Consortium is a good example of a challenge to the 538 methodology.

No matter what 538 is a hell of a lot better than the status quo practices previously existed to its founding in early 2008. The level of jealously directed toward Nate Silver is completely transparent.  If you want to get all Popperian – go right ahead but then you have little or nothing to say about this or most other prediction problems.  This is what happened in quantitative finance / algo trading and the arbitrage went to those who were not worried about whether what they were doing was science or just engineering [insert Sheldon Cooper quote here] .

One thing we can hope comes out of all this is that all of the data free speculation that was undertaken prior to the election can be put to bed.  I talking about you Dick Morris, Karl Rove, etc. – perhaps you guys should consider retirement and leave the arguments to the serious quants.

9 Weeks to Go — House and Senate Control as Measured by the Iowa Electronic Market

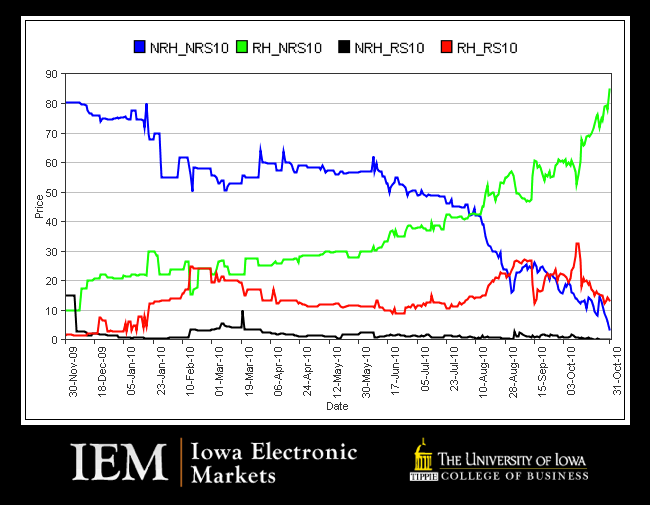
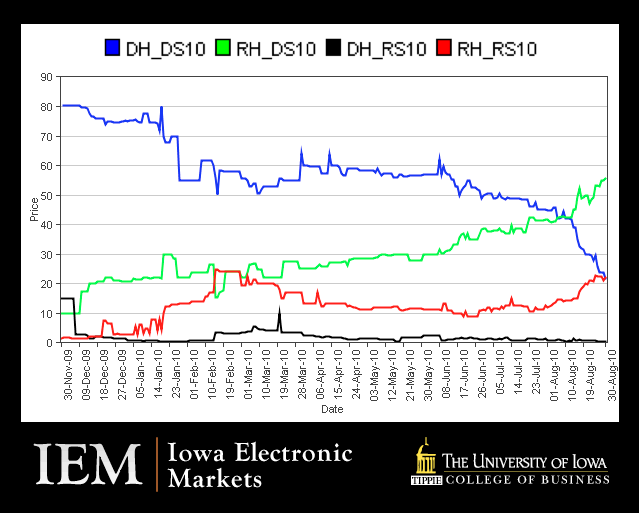
With nine weeks to go before the 2010 Midterm Elections, it is worth checking in with Iowa Electronic Markets to see where things stand. “The IEM 2010 Congressional Election Markets are real-money futures markets where contract payoffs will be determined by the votes cast in the 2010 U.S. Congressional Elections. “Congress10” (plotted above) is based on the composition of both houses of Congress.”

Take a look at the plot above. You will notice there has been significant movement in the past few weeks. Consistent with the beliefs of a number of pundits, the dominant scenario for 2010 is split control “RH_DS10” (i.e Republican House and Democrat Senate). Whether you view this outcome as good or bad, it is important to emphasize there is still time left and these trends could reverse.

Announcing the Beta Prerelease of the New Electronic World Treaty Index

What is the World Treaty Index?

The World Treaty Index (WTI), originally compiled by Peter Rohn in the 1960s and 1970s and subsequently maintained and updated at the University of Washington, is a comprehensive list of all known treaties formed during the twentieth century.  This includes not only treaties formally registered with the United Nations (UNTS) but a significant number of unregistered agreements.

What information does the World Treaty Index provide?

The WTI provides information on the parties to the agreement, the general topic of the agreement (e.g. trade agreement, tax agreement, an arms control agreement, etc.), as well as the signing date and the date in force, and the volume and page containing the text of the agreement.  Though the WTI does not provide the full text of each agreement, it is an excellent resource for identifying when a state (or states) formed a number of international agreements of a particular type.  With a list of relevant agreements (including their volume and page number), an end user interested in obtaining the full text can simply collect them using the primary source material (i.e. UNTS, LTS, etc.)

Who is currently administrating the World Treaty Index?

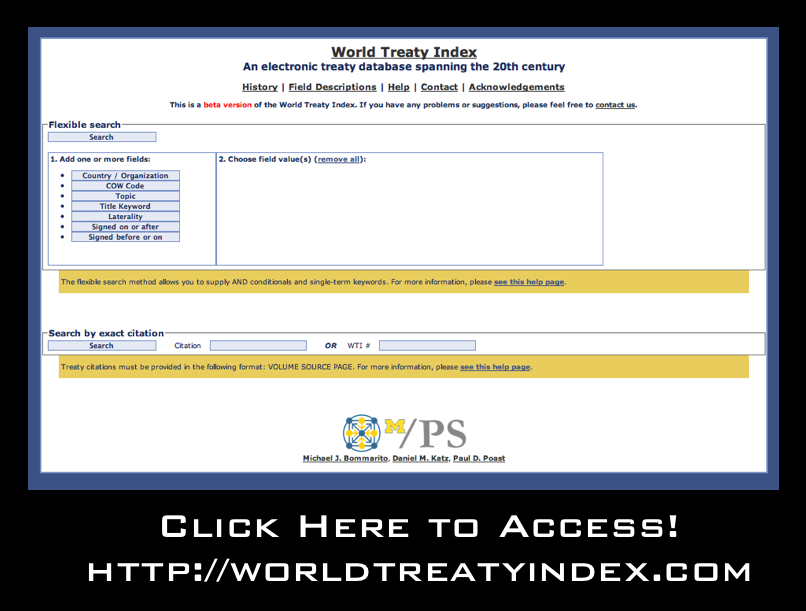
The Electronic WTI is now housed at the University of Michigan and administrated by Michael BommaritoDaniel Martin Katz and Paul Poast. We are highlighting the newly constructedBeta Prerelease of the WTI website in an effort to obtain feedback prior to the official release. The currently available product provides access to information on more than 58,000bilateral and multilateral treaties formed between 1900 and 1997. When full coverage for the 20th century is complete, the database should feature in excess of 70,000 agreements.

What are some examples of searches I can conduct on the World Treaty Index website?

While the WTI should support all browsers, we suggest using Firefox.  Below are three sample searches.

Search #1: Suppose a user would like to collect all agreements involving Brazil. Use the “flexible search” and follow three easy steps.  (A) Select the country/organization field  (B) within the country/organization field set the field value = Brazil  (C) click the search button.

Search #2: Suppose a user would like to collect all agreements between Mexico and Spain. Use the “flexible search” and follow five easy steps.  (A) Select the country/organization field  (B) within the country/organization field set the field value = Mexico (C) Select a second country/organization field (B) within this new country/organization field set the field value = Spain  (E) now click the search button.

Search #3: Suppose a user would like to know how many extradition agreements France signed between 1950 and 1962.  This is similar to the examples above but involves the topic, signed on or after and signed before or on fields. After the user chooses the proper search fields and selects the search information, the WTI will produce on the screen a list of the desired agreements and provide the option of downloading the list as a CSV file.

When will it feature full coverage for the entire 20th Century?

By the end of 2010, we will add (1) all bilateral treaties formed between 1900 and 1944 [Now Mostly Done] (2) all bilateral treaties formed between 1998 and 1999, and (3) all multilateral agreements and a list of all parties to each multilateral agreement.  If you know of an agreement that is not ultimately featured on the site please contact us and we will be happy to add it to the list.

How can I learn more about the World Treaty Index?

For a general history of the World Treaty Index, visit the “History Page” on the worldtreatyindex.com website.  For a more detailed treatment please see: Glenda Pearson, Rohn’s World Treaty Index: Its Past and Future, 29 International Journal of Legal Information 543 (2001).

What additional extensions of the Electronic World Treaty Index are planned?

As noted above, our initial goal is provide complete coverage of all known agreements in the 20th Century. Planned extensions include bringing the World Treaty forward so as to provide coverage up to 2010.  In addition, we plan to collect information regarding treaty terminations. Finally, we would like to enhance the granularity of our topic codes and allow for agreements with multiple dimensions to feature multiple topic codes.

Feedback?

At this point, we have only offered a beta pre-release of the site. Thus, we would really appreciate your feedback, etc. Please email us at worldtreatyindex@gmail.com if you have any thoughts about how to improve the site.

Measuring the Complexity of the Law : The United States Code

Understanding the sources of complexity in legal systems is a matter long considered by legal commentators. In tackling the question, scholars have applied various approaches including descriptive, theoretical and, in some cases, empirical analysis. The list is long but would certainly include work such as Long & Swingen (1987), Schuck (1992), White (1992), Kaplow (1995), Epstein (1997), Kades (1997), Wright (2000) and Holz (2007). Notwithstanding the significant contributions made by these and other scholars, we argue that an extensive empirical inquiry into the complexity of the law still remains to be undertaken.

While certainly just a slice of the broader legal universe, the United States Code represents a substantively important body of law familiar to both legal scholars and laypersons. In published form, the Code spans many volumes. Those volumes feature hundreds of thousands of provisions and tens of millions of words. The United States Code is obviously complicated, however, measuring its size and complexity has proven be non-trivial.

In our paper entitled, A Mathematical Approach to the Study of the United States Code we hope to contribute to the effort by formalizing the United States Code as a mathematical object with a hierarchical structure, a citation network and an associated text function that projects language onto specific vertices.

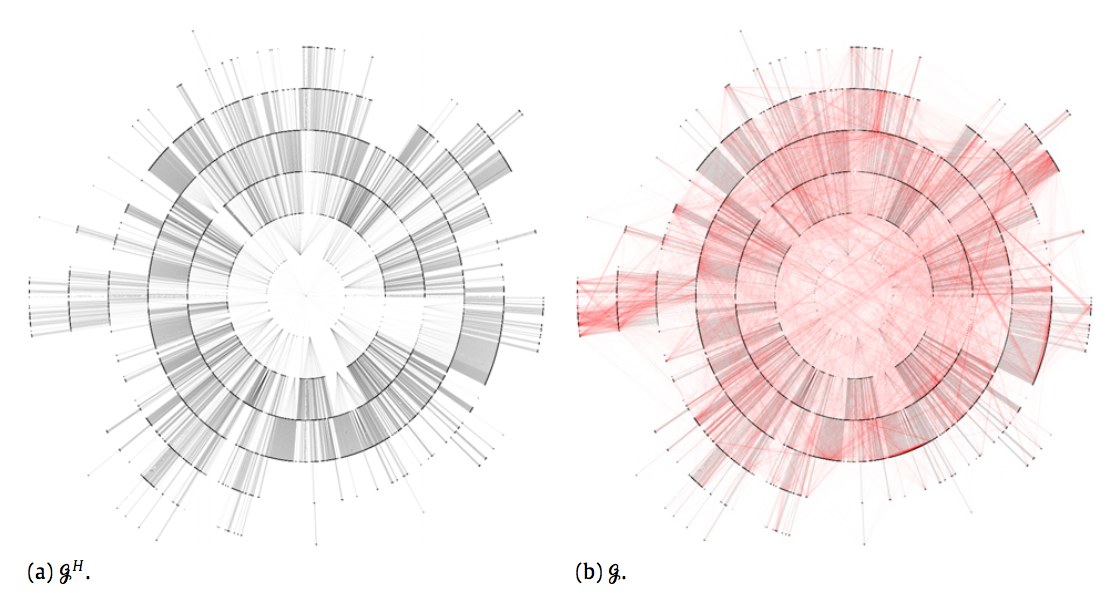
In the visualization above, Figure (a) is the full United States Code visualized to the section level. In other words, each ring is a layer of a hierarchical tree that halts at the section level. Of course, many sections feature a variety of nested sub-sections, etc. For example, the well known 26 U.S.C. 501(c)(3) is only shown above at the depth of Section 501.  If we added all of these layers there would simply be additional rings. For those interested in the visualization of specific Titles of the United States Code … we have previously created fully zoomable visualizations of Title 17 (Copyright), Title 11 (Bankruptcy),  Title 26 (Tax) [at section depth], Title 26 (Tax) [Capital Gains & Losses] as well as specific pieces of legislation such as the original Health Care Bill — HR 3962.

In the visualization above, Figure (b) combines this hierarchical structure together with a citation network.  We have previously visualized the United States Code citation network and have a working paper entitled Properties of the United States Code Citation Network. Figure (b) is thus a realization of the full United States Code through the section level.

With this representation in place, it is possible to measure the size of the Code using its various structural features such as vertices V and its edges E.  It is possible to measure the full Code at various time snapshots and consider whether the Code is growing or shrinking. Using a limited window of data, we observe growth not only in the size of the code but also its network of dependancies (i.e. its citation network).

Of course, growth in the size United States Code alone is not necessarily analogous to an increase in complexity.  Indeed, while we believe in general the size of the code tends to contribute to “complexity,” some additional measures are needed.  Thus, our paper features structural measurements such as number of sections, section sizes, etc.

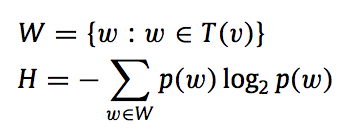
In addition, we apply the well known Shannon Entropy measure (borrowed from Information Theory) to evaluate the “complexity” of the message passing / language contained therein.  Shannon Entropy has a long intellectual history and has been used as a measure of complexity by many scholars.  Here is the formula for Shannon entropy:

For those interested in reviewing the full paper, it is forthcoming in Physica A: Statistical Mechanics and its Applications. For those not familiar, Physica A is a journal published by Elsevier and is a popular outlet for Econophysics and Quantitative Finance. A current draft of the paper is available on the SSRN and the physics arXiv

We are currently working on a follow up paper that is longer, more detailed and designed for a general audience.  Even if you have little or no interest in the analysis of the United States Code, we hope principles such as entropy, structure, etc. will prove useful in the measurement of other classes of legal documents including contracts, treaties, administrative regulations, etc.

Oklahoma’s Infamous Ballot Initiative – State Question 755 [Via the Economist]

In addition to my interests related to the theme of this blog, I have a number of ongoing projects related to American direct democracy. Thus, I will be following with interest the recent developments in Oklahoma. According to the Economist, “… Rex Duncan, a Republican member of Oklahoma’s House of Representatives has just had a measure placed on the November ballot that would ban local courts from considering sharia, or Islamic law, in their judgments.” Proponents of the measure have dubbed it the “Save our State” amendment. State Question Number 755 will ask voters to amend Section 1 of Article VII of the state Constitution to require the state courts to rely only on federal and state law when deciding cases. It forbids courts from considering or using Sharia law.

Suffice to say, the Economist was less than impressed with actions of the Oklahoma Legislature.  Indeed, I have reviewed virtually every ballot initiative across every State for the past thirty years and would say even in the demagoguery laden world of American direct democracy that this represents some sort of a low point.

Iowa Electronic Markets: Who Will Win Control of the House in the 2010 Midterms?

For many years, the Iowa Electronic Markets have served as a futures market for political and economic information.  As we move to the fall, the race for control of the House (and in turn the Speakership) appears to hang in the balance.  The plot above offers both the current spot price as well as historic information regarding the markets’ perspective on this important race. Click here for information regarding this specific market.

Irrelevant Events Affect Voters’ Evaluations of Government Performance [PNAS]

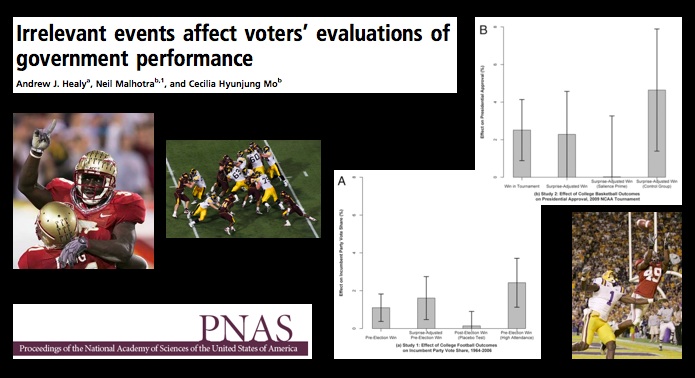
In PNAS this week Andrew J. Healy, Neil Malhotra, and Cecilia Hyunjung Mo offer Irrelevant Events Affect Voters’ Evaluations of Government Performance.  From the abstract:  “Does information irrelevant to government performance affect voting behavior? If so, how does this help us understand the mechanisms underlying voters’ retrospective assessments of candidates’ performance in office? To precisely test for the effects of irrelevant information, we explore the electoral impact of local college football games just before an election, irrelevant events that government has nothing to do with and for which no government response would be expected. We find that a win in the 10 days before Election Day causes the incumbent to receive an additional 1.61 percentage points of the vote in Senate, gubernatorial, and presidential elections, with the effect being larger for teams with stronger fan support. In addition to conducting placebo tests based on postelection games, we demonstrate these effects by using the betting market’s estimate of a team’s probability of winning the game before it occurs to isolate the surprise component of game outcomes. We corroborate these aggregate-level results with a survey that we conducted during the 2009 NCAA men’s college basketball tournament, where we find that surprising wins and losses affect presidential approval. An experiment embedded within the survey also indicates that personal well-being may influence voting decisions on a subconscious level. We find that making people more aware of the reasons for their current state of mind reduces the effect that irrelevant events have on their opinions. These findings underscore the subtle power of irrelevant events in shaping important real-world decisions and suggest ways in which decision making can be improved.”