Syllabus–Modeling Law as a Complex Adaptive System

Law as a CAS

Several months ago, I put together this syllabus for use in a future seminar course Law as a Complex System.   A number of my friends and colleagues noted that if were to actually use this syllabus in a course, it would be necessary to reduce the total reading in contained herein. While I completely agree, I still thought I would post it to the blog in its current form. I am proud to say that I am an award winning instructor.  Notwithstanding, I am always interested in improving my pedagogical skills. Thus, if you see any law related scholarship you believe should be included please feel free to email me.

Data on the Law Clerkship Tournament: Take 2

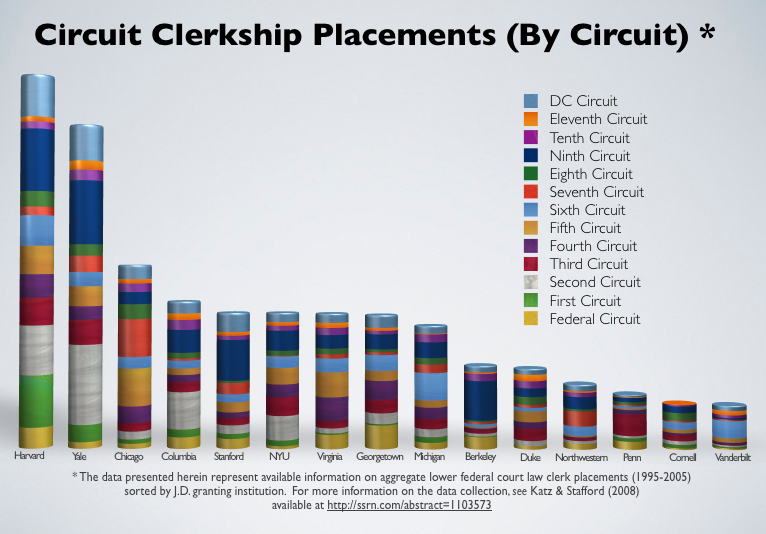
Circuit Clerk Tourney

Highlighting underlying data Derek Stafford and I collected for our article Hustle and Flow: A Social Network Analysis of the American Federal Judiciary — here is some additional information on the law clerk tournament.  In the original post, we highlighted both Circuit and District Court Clerkship Placements for the 1995-2005 period.

Using only the Circuit Court data, we thought it might be interesting to consider how those placements are distributed across the various circuits.  At first glance, observe the regional or home turf bias contained in the placements (Penn 3rd Circuit ; Vanderbilt 6th Circuit).  Furthermore, consider institutions whose placements are highly concentrated (Berkeley 9th Circuit) versus institutions with more diffuse placements (Michigan, Chicago).  

The Bailout Breakdown from the Associated Press

Bailout Breakdown

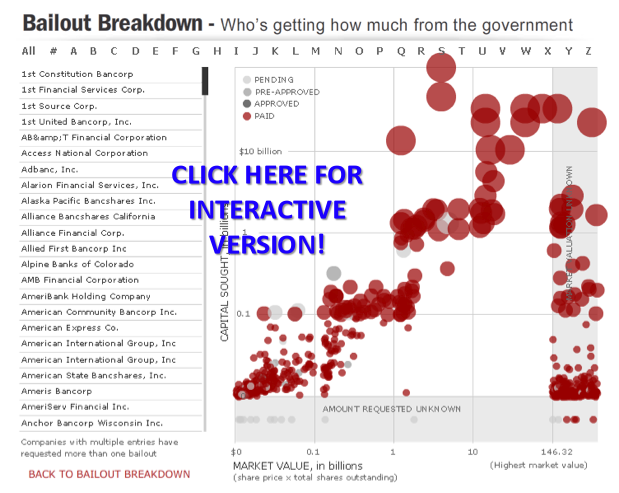
Datavisualization.ch/ recently highlighted this interactive “Bailout Breakdown” offered by the Associated Press….. “Bailout Breakdown from Associated Press is an interactive applet that lets the user analyze the recipients and amounts of the $700 Billion bailout plan from the American government. The data is presented as a scatterplot with additional information about the representations when the hovers over a plotted item. The markers are color coded to distinguish between pending, pre-approved, approved and paid status.”  At the end of his post, Benjamin Wiederkehr offers some principled critiques of the visualization techniques employed by the authors. Notwithstanding, we still thought it was still worthy of highlighting.

Classifying the US Patent Hierarchy

Patent Classifications

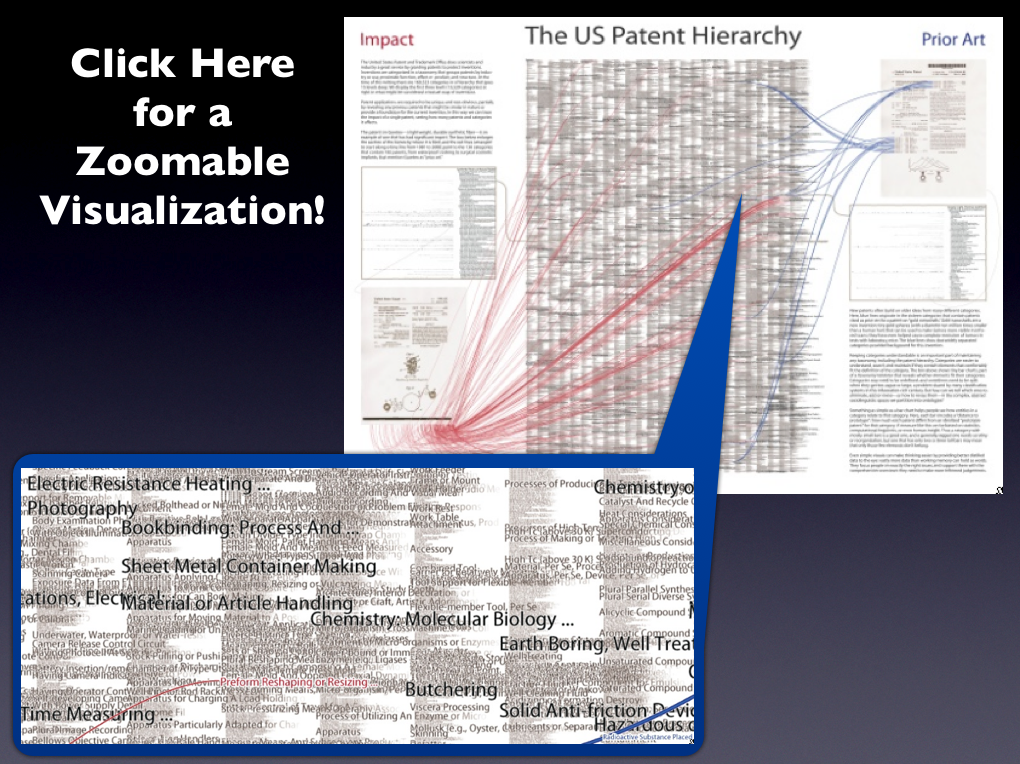
The United States Patent and Trademark Office patent classification scheme organizes 3 million patents into about 160,000 distinct patent classes. This visualization by Katy Börner, Elisha Hardy, Bruce W. Herr II, Todd M. Holloway, & W. Bradford Paley considers the organizational schema used to classify patents at the US Patent Office.  Their article Taxonomy Visualization in Support of the Semi-Automatic Validation and Optimization of Organizational Schemas was published in the Journal of Informetrics in 2007.

From the Abstract: “The taxonomy visualization and validation (TV) tool introduced in this paper supports the semi-automatic validation and optimization of organizational schemas such as file directories, classification hierarchies, taxonomies, or other structures imposed on a data set for organization, access, and naming. By showing the “goodness of fit” for a schema and the potentially millions of entities it organizes, the TV tool eases the identification and reclassification of misclassified information entities, the identification of classes that grow too large, the evaluation of the size and homogeneity of existing classes, the examination of the “well-formedness” of an organizational schema, and more.” 

The Real Estate Roller Coaster — Visualizing the Speculative Bubble

Riding the Coaster!

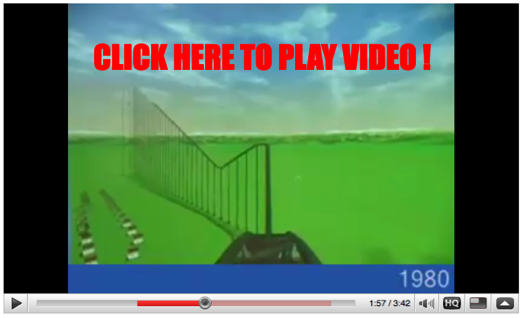
We are working hard to produce more original content for the site.  In the meantime, we want to share some of our favorite projects and papers. Many of you have probably seen this visualization of housing prices–including the run up to 2007. For those of you not previously familiar, the authors plotted inflation adjusted US Home Prices (1890-2006) on a roller coaster!  Pretty creative stuff….  

Perils of Interdisciplinary Scholarship — Evading the Discipline Police?

Disciplinary Police

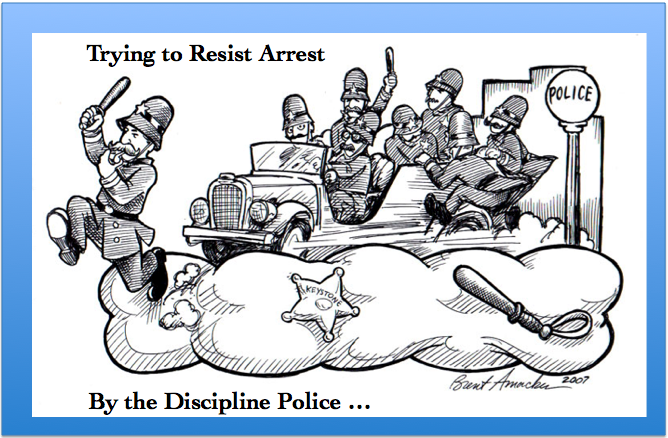
It is difficult to traverse the broad disciplinary landscape. We feel so fortunate to work with a community here at Michigan which is committed to resisting those who seek to restrict intellectual innovation–individuals we characterize as the disciplinary police. Since starting this blog, we have received several emails from legal, social and physical science scholars interested in intellectual exploration, intellectual diversity.  We appreciate their encouragement and will proudly continue to privilege “exploration over exploitation.”

In that vein, we wanted to offer some of our favorite recent papers drawn from a wide variety disciplines….

FIVE PAPERS FROM VARIOUS DISCIPLINES WE WANT TO HIGHLIGHT:

Gergely Palla, Albert-László Barabási & Tamás Vicsek, Quantifying Social Group EvolutionNature 446664-667 (5 April 2007)

John Mikhail, Universal Moral Grammar: Theory, Evidence, and the Future, 11 Trends in Cognitive Sciences 143 (2007)

Jenna Bednar & Scott Page, Can Game(s) Theory Explain Culture? (The Emergence of Cultural Behavior Within Multiple Games), Rationality and Society, 19: 65-97 (2007).

Riley Crane & Didier Sornette (2008) Robust Dynamic Classes Revealed by Measuring the Response Function of a Social SystemProc. Nat. Acad. Sci. 105: 15649-15653.

Frans de Waal, Kristen Leimgruber & Amanda Greenberg (2008). Giving is Self-Rewarding for MonkeysProc. Nat. Acad. Sci. 105: 13685-13689.

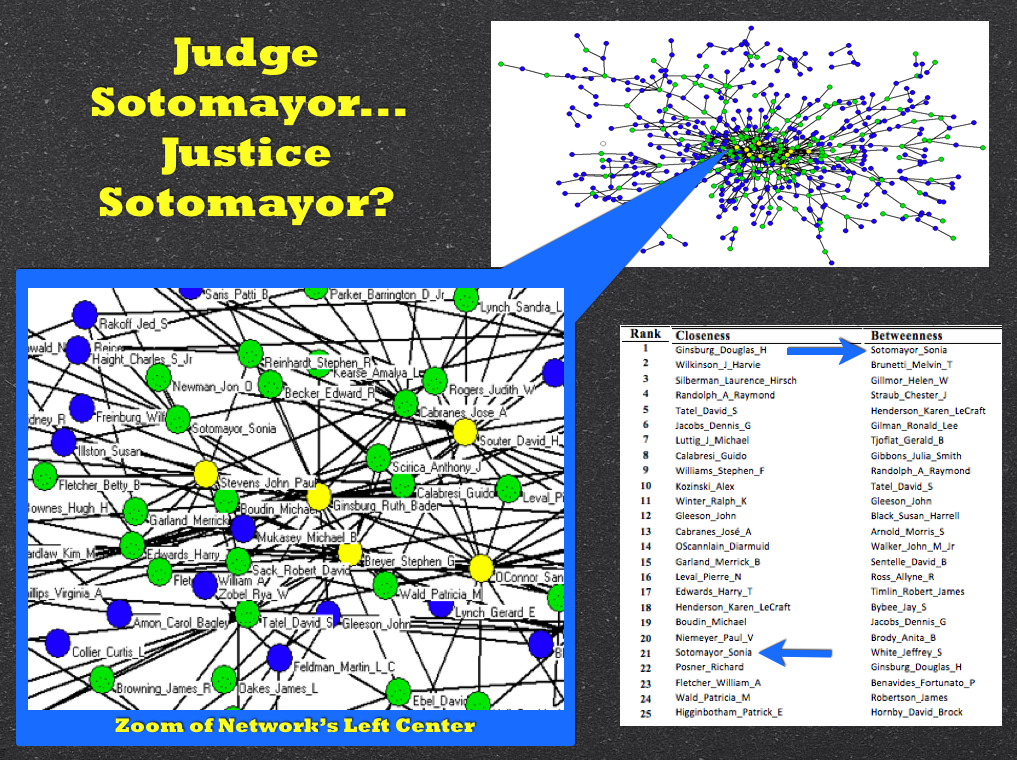
Judge Sonia Sotomayor ⇒ Justice Sotomayor?

Justice Sotomayor?

Justice Souter’s recently announced retirement has generated significant speculation regarding the potential nominee President Obama might select.    

Barring some unknown skeleton in her closet, if President Obama seeks to (1) select a Federal Court of Appeals Judge and (2) increase the diversity of the Court on multiple dimensions …. well … Judge Sotomayor would have to be the frontrunner.  

The picture and graph statistics pictured above are drawn from our paper Hustle and Flow: A Social Network Analysis of the American Federal Judiciary.  In the paper, we offer a mapping of the social topology of the American Federal Judiciary.  Built upon data aggregated over the Natural Rehnquist Court (1995-2004), we find Judge Sotomayor holds a position of significant social prominence.  

To read more on operationalization, etc.—click on the slide above or click here.

A number of commentators have suggested President Obama might forgo nominating a sitting judge — instead choosing an academic or politician.  This is certainly a possibility and in that vein let me reveal my bias in favor of Gov. Jennifer Granholm (for whom I formerly worked). 

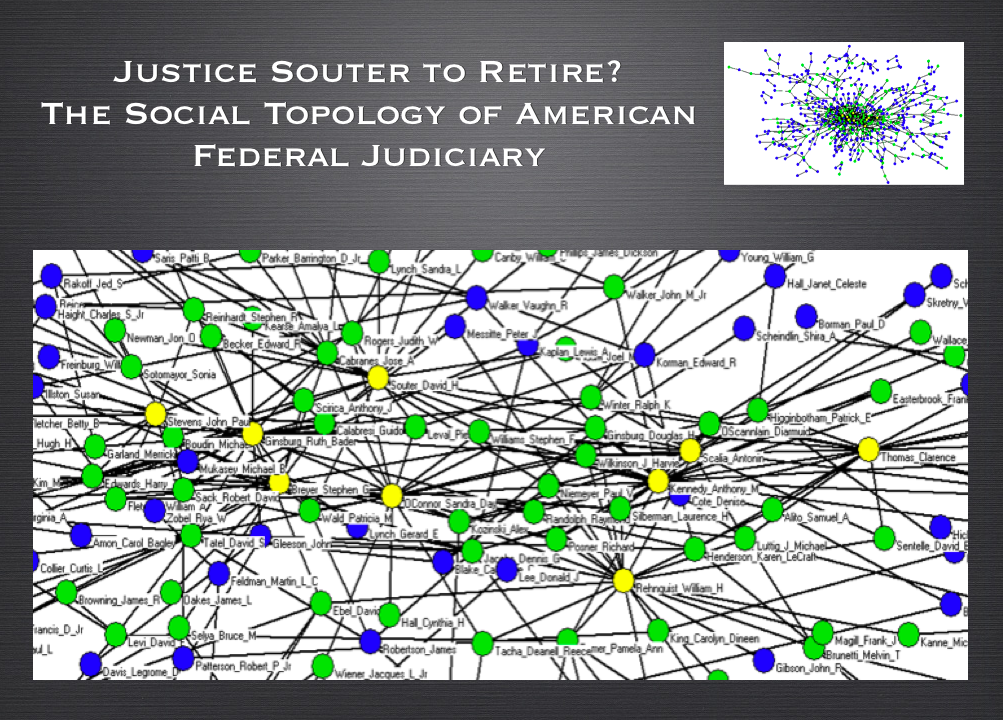
Justice Souter to Retire….Possible Replacements?…Here is a Mapping of Socially Prominent Jurists in the American Federal Judiciary

American Federal Judiciary

NPR’s Nina Totenberg is reporting that Justice Souter is planning to retire at the end of the current Supreme Court Term.  As noted in the NPR report, the short list of replacements may include Elena Kagan, Diane Wood and/or Sonia Sotomayor (who is in the network above near Justice Stevens).  If President Obama decides to look beyond this early short list, he might consider one of the socially prominent federal jurist mapped in above visualization. We have a much more detailed prior post on the underlying paper Hustle and Flow: A Social Network Analysis of the American Federal Judiciary located here.  To see the full visualization contained within the paper, click on the slide above or click here.       

Taking Judicial Content Seriously–Lupu & Fowler’s Strategic Content Model

Roe v. Wade Citation Network

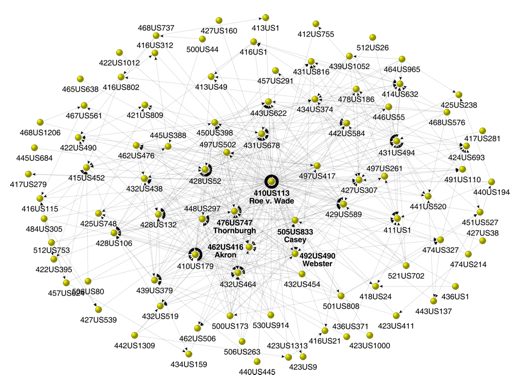
In my conversations with judicial politics scholars, many lament how many of our existing approaches tend to ignore opinion content.  For those interested in embedding opinion content into existing theories of judicial decision making … consider Yonatan LupuJames Fowler’s paper recently posted to the SSRN.  

The authors present a strategic model of judicial bargaining over opinion content.  They note … “we find that the Court generates opinions that are better grounded in law when more justices write concurring opinions.”  To generate the specification for “grounding in law” the authors use Kleinberg’s Hubs and Authorities Algorithm calculated at the time the opinion was authored. The Strategic Content Paper is available here. 

The visual above is drawn from a related Fowler project located here.  Another very worthwhile paper authored by FowlerJohnsonSpriggs, Jeon & Wahlbeck is located here.  

The S.I.R. Model — A Simple Model With Applications to Swine Flu, etc.


Virus on a Network

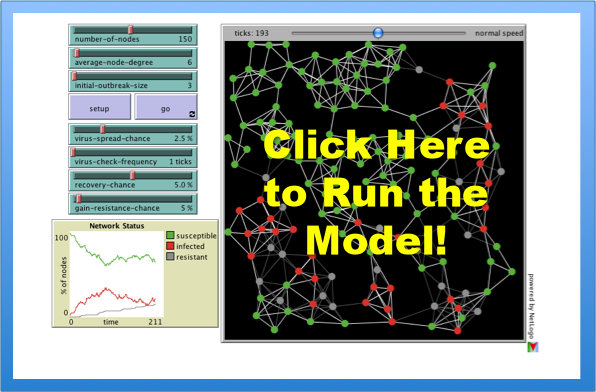
Last week we offered a model of intellectual diffusion built upon a standard fare social epidemiology model.  Given recent events within the United States, Mexico and potentially worldwide, we thought it would be worthwhile to highlight the classic S.I.R. (Susceptible, Infected, Recovered) model.  Netlogo offers a user friendly version of the model.  Using this platform, we hope the exploration of the dynamics of S.I.R. might prove illuminating.    

First, various hosts have different levels of interactions (work, home, transit, etc.) and so this network approach represents a blunt measure.   To start the model at the default parameters, push the SETUP Button and then the GO Button.  As the model runs, the plot tracks the Susceptible, Infected, Recovered.  The model contains a variety of  “sliders.”  The model can be rerun at lots of combinations of parameter levels.  Those “sliders” fall into several categories: Network Attributes, Virus Attributes, Node Attributes.   The full documentation is available here.  

With respect to the swine flu, one important parameter is the delay between when an individual becomes infectious and when that individual is likely to become symptomatic.  This parameter can be tuned in the simulation above using VIRUS-CHECK-FREQUENCY slider.  From the documentation… “Infected nodes are not immediately aware that they are infected. Only every so often (determined by the VIRUS-CHECK-FREQUENCY slider) do the nodes check whether they are infected by a virus.”  

An additional parameter worthy of consideration is the VIRUS-SPREAD-CHANCE.  Consider this slider as a rough measure of the underlying infectiousness of the virus in question.        

It is important to note the above simulation is an incredible simplification of the world faced by public health officials.  Additionally, this version of the model was designed to consider the spread of disease on a computer network.  Notwithstanding these limitations, we thought it useful to highlight a computational approach to this important matter of public concern.