Month: September 2009
Algorithmic Community Detection in Networks
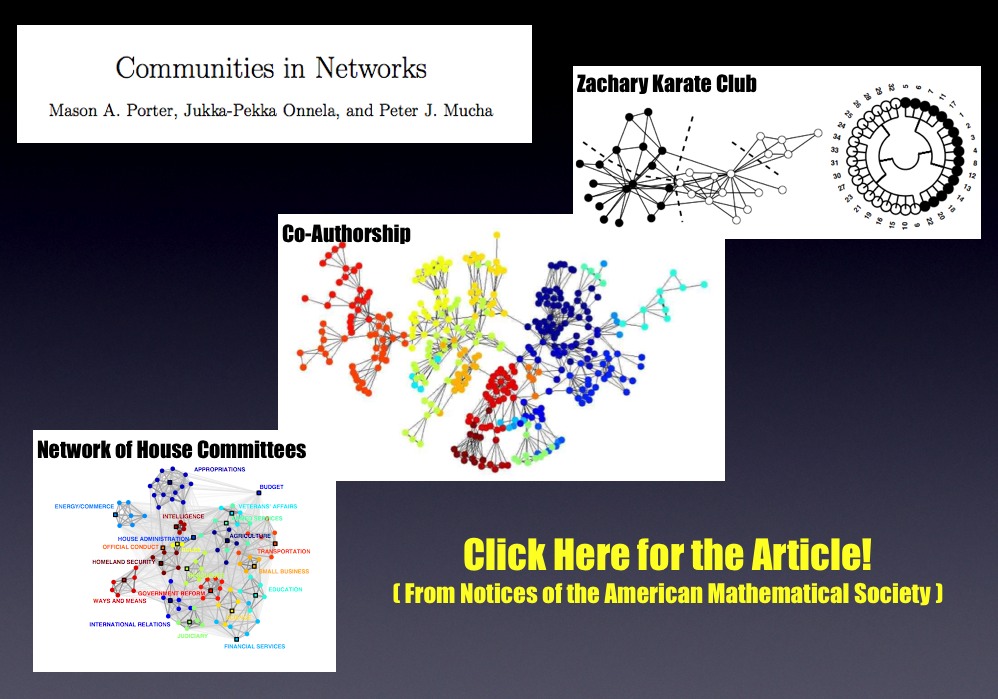
Community detection in networks is an extremely important part of the broader network science literature. For quite a while, we have meant to highlight the extremely useful review article written by Mason Porter (Oxford) Jukka-Pekka Onnela (Harvard/Oxford) and Peter J Mucha (UNC). Rather than offer our description of the article, we thought it best to highlight commentary on the subject provided by the authors.
For example, in describing the paper over at Harvard’s Complexity and Social Networks Blog Jukka-Pekka Onnela posted the following… “Uncovering the “community” structure of social networks has a long history, but communities play a pivotal role in almost all networks across disciplines. Intuitively, one can think of a network community as consisting of a group of nodes that are relatively densely connected to each other but sparsely connected to other dense groups of nodes. Communities are important because they are thought to have a strong bearing on functional units in many networks. So, for example, communities in social networks can correspond to different social groups, such as family, whereas web pages dealing with a given subject tend to form topical communities. The concept is simple enough, but it turns out that coming up with precise mathematical definitions and algorithms for community detection is one of the most challenging problems in network science. Recently, a lot of the research in this area has been done using ideas from statistical physics, which has an arsenal of tools and concepts to tackle the problem. Unfortunately (but understandably) relatively few non-physicists like to read statistical physics papers.”
These scholars quote Mark Newman noting “[T]he development of methods for finding communities within networks is a thriving sub-area of the field, with an enormous number of different techniques under development. Methods for understanding what the communities mean after you find them are, by contrast, still quite primitive, and much needs to be done if we are to gain real knowledge from the output of our computer programs.” They later note “the problem of how to validate and use communities once they are identified is almost completely open.”
Anyway, if you are interested in learning more about this important piece of the network science toolkit … we suggest you read this paper!
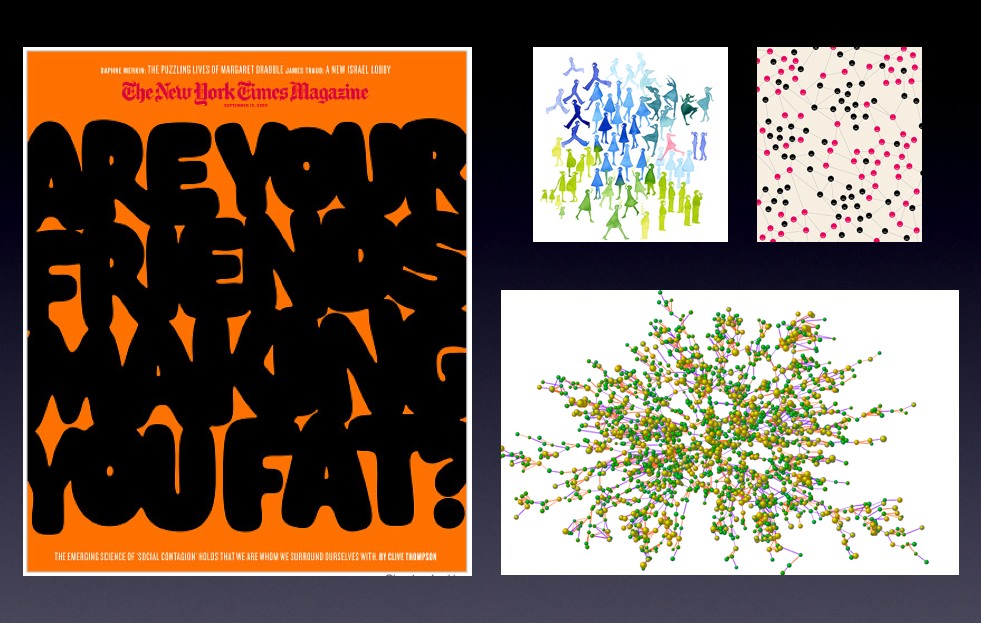
Christakis and Fowler in Wired Magazine
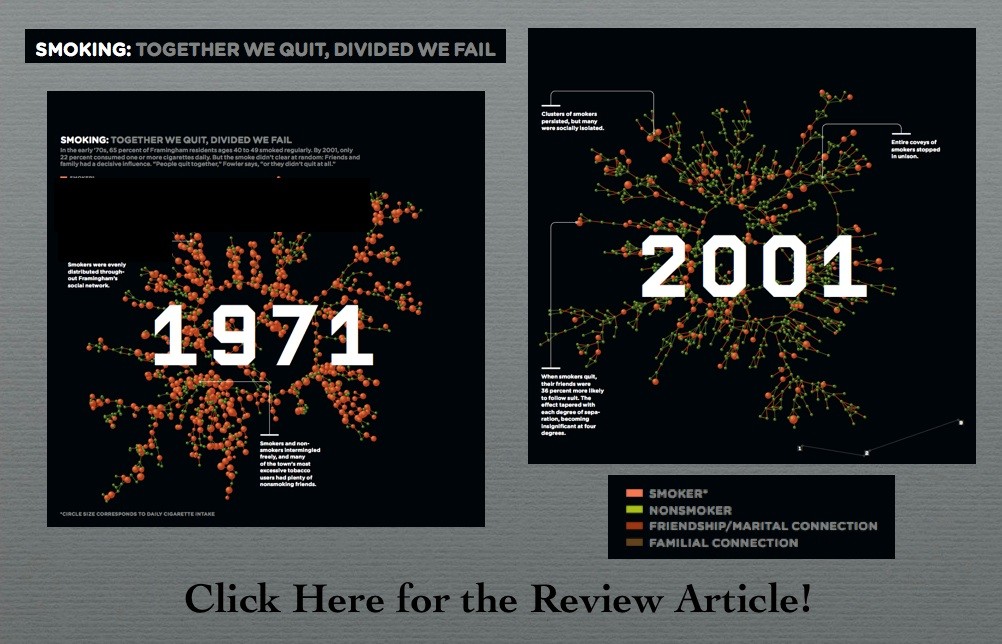
Today marks the official release of Connected: The Surprising Power of Our Social Networks and How They Shape Our Lives by Nicholas A. Christakis & James H. Fowler. There has been some really good publicity for the book including the cover story in last Sunday’s New York Times Magazine. However, given the crisp visualizations — my favorite is the above article from Wired Magazine. Click on the visual above to read the article!
Workshop on Information in Networks ( WIN @ NYU Stern)
Finished the First Day of the Two Day Workshop on Information in Networks. This has been a really great conference thus far. Both the speakers and the participants in the poster session have all offered very high quality work. We were very happy to be able to participate!
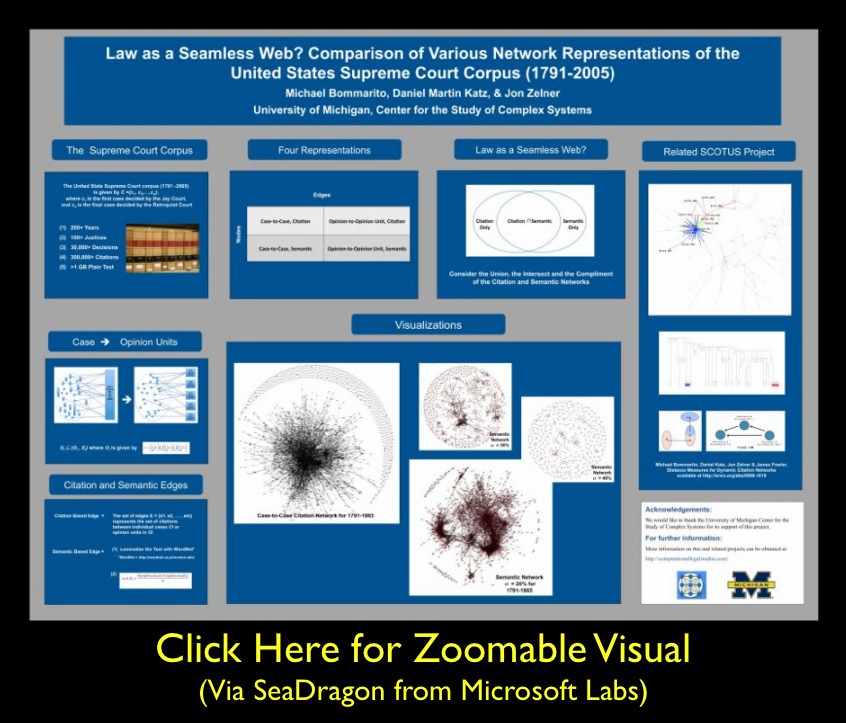
Law as a Seamless Web … Poster for WIN Conference @ NYU Stern
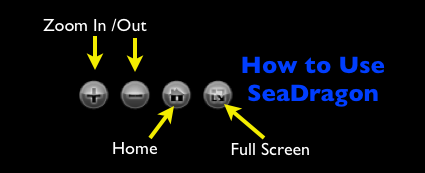
As we mentioned in previous posts, Seadragon is a really cool product. Please note load times may vary depending upon your specific machine configuration as well as the strength of your internet connection. For those not familiar with how to operate it please see below. In our view, the Full Screen is best the way to go ….
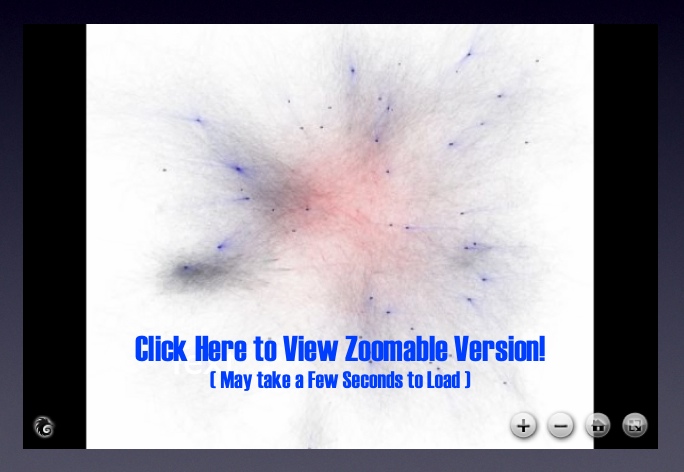
The Structure of the United States Code [With Zoomorama]
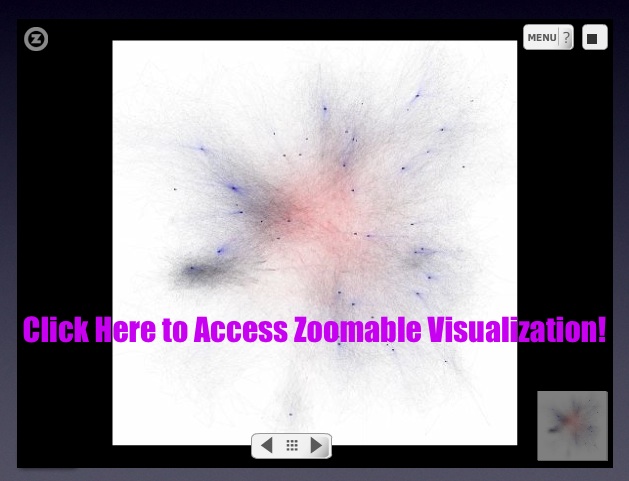
Above we offer the same visual of the United States Code (Titles 1-50) which we previously offered here … this time we are using Zoomorama. Zoomorama is an alternative to Seadragon which we believe might perform better on certain machine configurations.
Essentially, we do not want people to miss out on the visualization simply because their computer does not feature the necessary software/plugins. While some class of endusers still might not be able to view either version, we hope this alternative version will maximize the chances that it would be visable.
So, feel free to scroll over the visual using your mouse. For optimal viewing, however, we believe the full screen visual is the best way to go. Click on the square icon in the upper lright corner to make the visual full size. Click Here for the Zoomorama Instructions!
The Structure of the United States Code
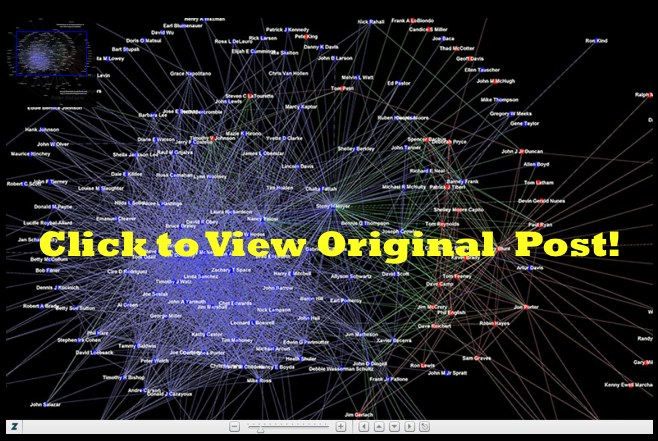
Formally organized into 50 titles, the United States Code is the repository for federal statutory law. While each of the 50 titles define a particular substantive domain, the structure within and across titles can be represent as a graph/network. In a series of prior posts, we offered visualizations at various “depths” for a number of well know U.S.C. titles. Click here and click Here for our two separate visualizations of the Tax Code (Title 26). Click here for our visualization of the Bankruptcy Code (Title 11). Click here for our visualization of Copyright (Title 17). While our prior efforts were devoted to displaying the structure of a given title of the US Code, the visualization above offers a complete view of the structure of the entire United States Code (Titles 1-50).
Using Seadragon from Microsoft Labs, each title is labeled with its respective number. The small black dots are “vertices” representing all sections in the aggregate US Code (~37,500 total sections). Given the size of the total undertaking, in the visual above, every title is represented to the “section level.” As we described in earlier posts, a “section level” representation halts at the section and thus does not represent any of subsection depth. For example, all sections under 26 U.S.C. § 501 including the well known § 501 (c) (3) are reattributed upward to their parent section.
There are two sources of structure within the United States Code. The explicitly defined structure / linkage / dependancy derives from the sections contained under a given title. The more nuanced version of structure is obtained from references or definitions contained within particular sections. This class of connections not only link sections within a given title but also connection sections across titles. Within this above visual, we represent these important cross-title references by coloring them red.
Taken together, this full graph of the Untied States Code is quite large {i.e. directed graph (|V| = 37500, |E| = 197749)}. There exist 37,500 total sections distributed across the 50 Titles. However, these sections are not distributed in a uniform manner. For example, components such as Title 1 feature very few sections while Titles such as 26 and 42 contain many sections. The number of edges far outstrips the number of vertices with a total 197,000+ edges in the graph.
 Seadragon has a number of nice features which enhance the experience of the end user. For example, a user can drag the image around by clicking and holding down the mouse button. Most importantly, is the symbol to the left. If you run your mouse over the above zoomable visual… look for this symbol to appear in the southeast corner. Click on it and it will make the visual full size… as you will see… the full size visual makes for a far more compelling HCI…
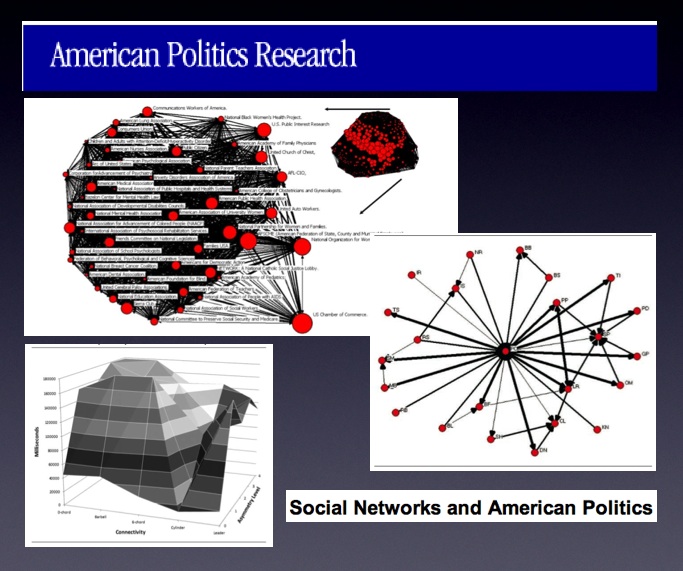
Special Social Networks Themed Issue of American Politics Research
There are a number of high quality interdisciplinary research groups here at Michigan. We are working with one of these groups — The Political Networks Lab. It is led by Michael Heaney (now here at Michigan in Organizational Studies). Michael is the author of numerous publications and was recently the guest editor of a special issue of American Politics Research. We wanted to highlight this recent issue as there are a number of articles that might be of interest. Click above to view the contents!

