The Journal of Social Structure is currently running an online visualization symposium that I would suggest checking out. Among the broader set of offerings, the readers of this blog might be particularly interested inPierre de Vries‘ work on the evolution of lobbying coalitions. Anyway, for those who want to learn more about the FCC lobbying project — check out the slide show above!
Jon Bruner from Forbes has created a really fun interface. Above I have highlighted Washtenaw County, MI (Ann Arbor and my home)); Travis County, TX (Austin); Washington, D.C. Click above and explore! {HT: Flowing Data}
Click on the above picture and you will be taken to the Interactive Gallery of Computational Legal Studies. Once inside the gallery, click on any thumbnail to see the full size image. Each image features a link to supporting materials such as documentation and/or the underlying academic paper. We hope to add more content to gallery over the coming weeks and months — so please check back! Please note that load time may vary depending upon your connection, machine, etc.
Above is a movie displaying Title 16 (Conservation) a subset of the content contained within the United States Code. At more than 2,400 pages (download it here), Title 16 is one of the larger titles in the US Code. Yet, it is not the largest. For example, Title 26 (Internal Revenue Code) and Title 42 (Public Health and Welfare) are far larger than the object displayed above.
Now, you might be wondering why we chose to generate this movie. We envisioned at least two purposes.
(1) The title of this blog is Computational Legal Studies. One of our major goals to either develop or apply tools that scale to life in the era of Big Data. Given the scope of an object such as the United States Code, it is is clear that a significant class of potential analysis cannot reasonably be undertaken without the use of computational tools. Thus, with respect to developing new insights, we believe computational linguistics, information theory, applied graph theory can be of great use. For those interested, our new paper entitled A Mathematical Approach to the Study of the United States Code offers our initial exploration of the possibilities.
(2) We believe this movie can be a meaningful pedagogical device. Many students enter law school and are dismayed when even in statutory based classes they are not exclusively reviewing the black letter law. Given the scope of this and other large bodies of documents, any model of legal education cannot be exclusively be dedicated to teaching black letter law. Instead, such training is appropriately devoted to a mixture of existing legal rules as well as the development of information acquisition protocols that train students to navigate the relevant landscape.
“Blaise Aguera y Arcas is an architect at Microsoft Live Labs, architect of Seadragon, and the co-creator of Photosynth, a monumental piece of software capable of assembling static photos into an interactive three-dimensional space. This seamless patchwork of images can be viewed via multiple angles and magnifications, allowing us to look around corners or “fly” in for a (much) closer look ….”
“Statistical Visual thinking will one day be as necessary for efficient citizenship as the ability to read and write.” {Revised Version of H.G. Wells Quote }
(1) The Supreme Court’s increasing reliance upon its own decisions over the 1800-1830 window.
(2) The important role of maritime/admiralty law in the early years of the Supreme Court’s citation network. At least with respect to the Supreme Court’s citation network, these maritime decisions are the root of the Supreme Court’s jurisprudence.
The Development of Structure in the SCOTUS Citation Network
The visualization offered above is the largest weakly connected component of the citation network of the United States Supreme Court (1800-1829). Each time slice visualizes the aggregate network as of the year in question.
In our paper entitled Distance Measures for Dynamic Citation Networks, we offer some thoughts on the early SCOTUS citation network. In reviewing the visual above note ….“[T]he Court’s early citation practices indicate a general absence of references to its own prior decisions. While the court did invoke well-established legal concepts, those concepts were often originally developed in alternative domains or jurisdictions. At some level, the lack of self-reference and corresponding reliance upon external sources is not terribly surprising. Namely, there often did not exist a set of established Supreme Court precedents for the class of disputes which reached the high court. Thus, it was necessary for the jurisprudence of the United States Supreme Court, seen through the prism of its case-to-case citation network, to transition through a loading phase. During this loading phase, the largest weakly connected component of the graph generally lacked any meaningful clustering. However, this sparsely connected graph would soon give way, and by the early 1820’s, the largest weakly connected component displayed detectable structure.”
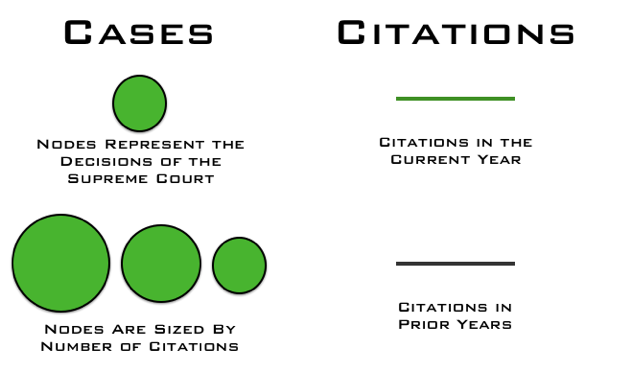
What are the elements of the network?
What are the labels?
To help orient the end-user, the visualization highlights several important decisions of the United States Supreme Court offered within the relevant time period:
Why do cases not always enter the visualization when they are decided?
As we are interested in the core set of cases, we are only visualizing the largest weakly connected componentof the United States Supreme Court citation network. Cases are not added until they are linked to the LWCC. For example, Marbury v. Madison is not added to the visualization until a few years after it is decided.
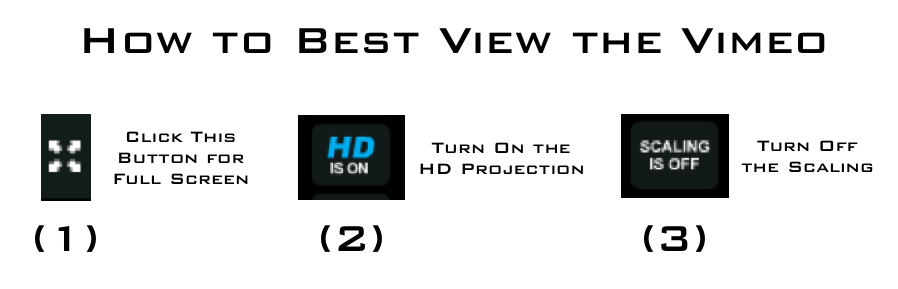
How do I best view the visualization?
Given this is a high-definition video, it may take few seconds to load. We believe that it is worth the wait. In our view, the video is best consumed (1) Full Screen (2) HD On (3) Scaling Off.
Where can I find related papers?
Here is a non-exhaustive list of related scholarship:
Starting with the Michael Bommarito’s twitter handle mjbommar, we built this visualization by collecting Mike’s direct friends, friends-friends, friends-friends-friends, etc. until we decided to stop …. just after passing 130,000 total twitter handles. Using the Fruchterman-Rheingold algorithm, we visualized a network where |V| = 130365, |E| = 197399.
Those interested in reviewing some other twitter visualizations, please consult Nathan Yau at Flowing Datawhohas collected some of his favorites. To our knowledge, the visualization we offer above is one the larger visualizations of twitter that have been produced to date.When you zoom in, you will notice we have flagged some of the celebrity twitter users we detected in the mjbommar friends-friends-friends, etc. network. For example, as shown above Ashton Kutcher (aplusk), Chad Ochocinco (OGOchOCinco) and RainnWilson (rainnwilson) are contained therein.
Given the budget limitations of this blog, we cannot host this visualization in house. However, if you click the picture above, you can access the visual from Seadragon … a zoomable visualization platform from Microsoft Labs.