Tag: structure of science
Relational Topic Models for Document Networks — Chang & Blei
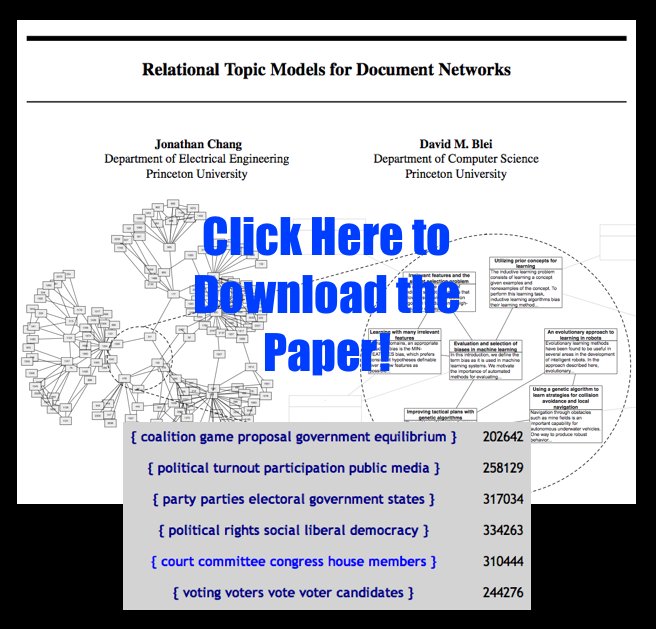
This is a very important paper by Jonathan Chang and David Blei. Suffice to say, it has potential use in a wide class of social science applications. Click here to access related material on Professor Blei’s Princeton homepage. Click here for some slides (note 7.0 mb). Check it out!
Well Formed Eigenfactor.Org–Wonderful Visualization of CrossDisciplinary Fertilization, Information Flow & The Structure of Science [Repost]
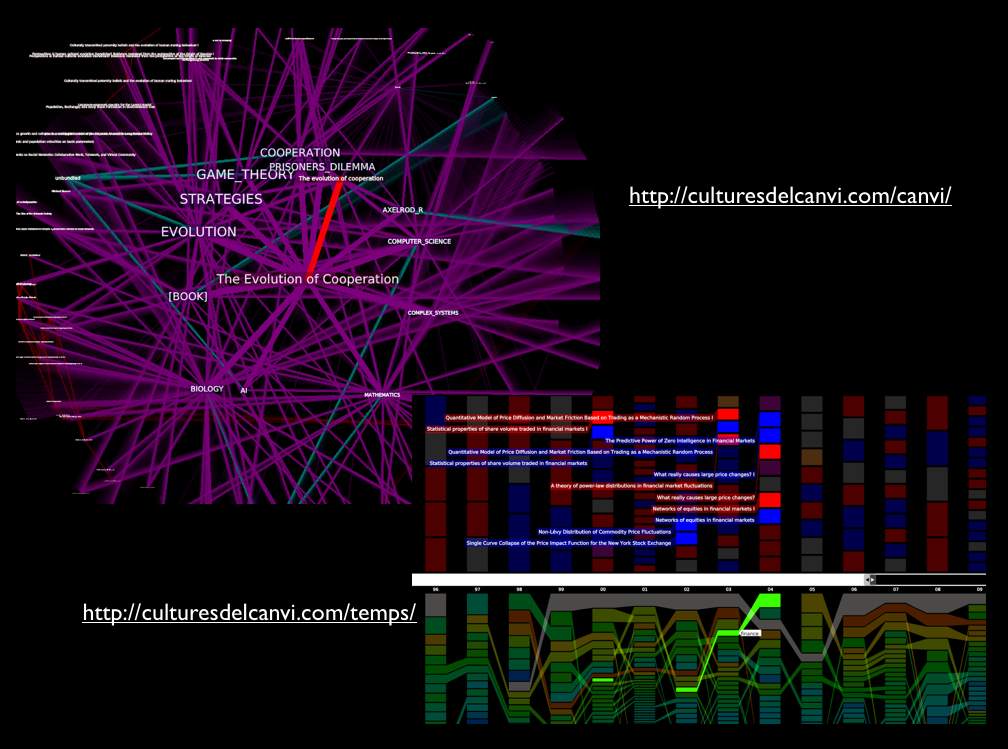
Given our interest in both interdisciplinary scholarship and the spread of ideas, we wanted to highlight one of our favorite projects–eigenfactor.org. Here is basic documentation from their website. There are also links to academic papers offering far more detailed documentation for the data and algorithm choice. In particular, read Martin Rosvall and Carl T. Bergstrom, Maps of Random Walks on Complex Networks, Proc. of the Nat. Academy of Sci. 105:1118-1123 (2007). The above visualizations are written in Flare by Moritz Stefaner. Click on the slide above to reach these interactive visualizations. These mapping offer reveal the reach of various publications across disciplines–some are insular and others have incredible reach. The inner rings are journals and the outer rings are the host disciplines. Enjoy!
Visualizing the East Anglia Climate Research Unit Leaked Email Network
As reported in a wide variety of news outlets, last week, a large amount of data was hacked from the Climate Research Unit at the University of East Anglia. This data included both source code for the CRU climate models, as well as emails from the individuals involved with the group. For those interested in background information, you can read the NY Times coverage here and here. Read the Wall Street Journal here. Read the Telegraph here. For those interested in searching the emails, the NY Times directs the end user to http://www.eastangliaemails.com/.
Given the data is widely available on the internet, we thought it would be interesting to analyze the network of contacts found within these leaked emails. Similar analysis has been offered for large datasets such as the famous Enron email data set. While there may be some selection issues associated with observing this subset of existing emails, we believe this network still gives us a “proxy” into the structure of communication and power in an important group of researchers (both at the individual and organization level).
To build this network, we processed every email in the leaked data. Each email contains a sender and at least one recipient on the To:, Cc:, or Bcc: line. The key assumption is that every email from a sender to a recipient represents a relationship between them. Furthermore, we assume that more emails sent between two people, as a general proposition indicates a stronger relationship between individuals.
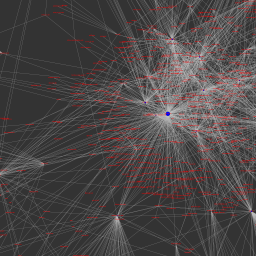
To visualize the network, we draw a blue circle for every email address in the data set. The size of the blue circle represents how many emails they sent or received in the data set – bigger nodes thus sent or received a disproportionate number of emails. Next, we draw grey lines between these circles to represent that emails were sent between the two contacts. These lines are also sized by the number of emails sent between the two nodes.
Typically, we would also provide full labels for nodes in a network. However, we decided to engage in partial “anonymization” for the email addresses of those in the data set. Thus, we have removed all information before the @ sign. For instance, an email such as johndoe@umich.edu is shown as umich.edu in the visual. If you would like to view this network without this partial “anonymization,” it is of course possible to download the data and run the source code provided below.
Note: We have updated the image. Specifically, we substituted a grey background for the full black background in an effort to make the visual easier to read/interpret.
Click here for a zoomable version of the visual on Microsoft Seadragon.
Don’t forget to use SeaDragon’s fullscreen option:

Hubs and Authorities:
In addition to the visual, we provide hub and authority scores for the nodes in the network. We provide names for these nodes but do not provide their email address.
Authority
- Phil Jones: 1.0
- Keith Briffa: 0.86
- Tim Osborn: 0.80
- Jonathan Overpeck: 0.57
- Tom Wigley: 0.54
- Gavin Schmidt: 0.54
- Raymond Bradley: 0.52
- Kevin Trenberth: 0.49
- Benjamin Santer: 0.49
- Michael Mann: 0.46
Hubs returns nearly identical ranks with slightly perturbed orders with the notable exception that the UK Met Office IPCC Working Group has the highest hub score.
Thus, so far as these emails are a reasonable “proxy” for the true structure of this communication network, these are some of the most important individuals in the network.
Source Code:
Unlike some existing CRU code, the code below is documented, handles errors, and is freely available.
Law in Structure of Academic Disciplines [Repost]
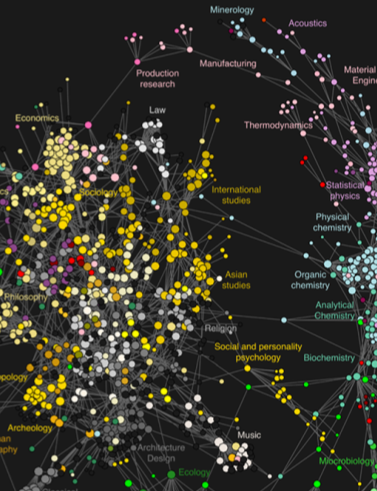
This article offers a very interesting insight into the structure of academic disciplines. Using a variety of sources, the authors collected nearly 1 billion interactions from scholarly web portals including Thomson Scientific, Elsevier, JSTOR, etc.
Residing between Economics, Sociology and International Studies, notice the location for legal studies in the upper center portion of this screen print.
The Full Size visualization as well as relevant analytics are available within the paper. Among other things, the approach undertaken by Johan Bollen, Herbert Van de Sompel, Aric Hagberg, Luis Bettencourt, Ryan Chute, Marko A. Rodriguez & Lyudmila Balakireva provides an alternative view of the current structure of the academic disciplines from that offered in existing bibliometric studies.
Collaboration Among Political Science Network Scholars
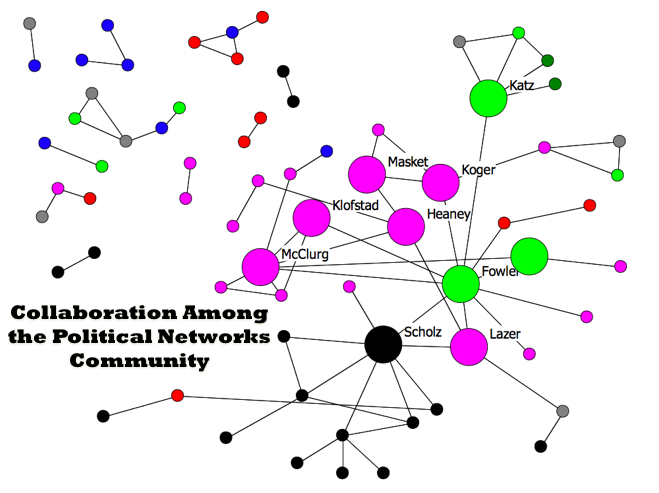 At the recent Networks in Political Science Conference (Harvard 2009), Ramiro Berardo from Arizona presented a paper entitled Networking Networkers: An Exploration of the Patterns of Collaboration among Attendees to the First Harvard Political Networks Conference. The above visual displays the patterns of collaboration among the growing networks community within Political Science. Major scholars in the field including James Fowler, John Scholz, David Lazar and Scott McClurg are displayed. In the northeast corner of the graph you can observe yours truly, Daniel Katz. At the rate he is going, it will not be long until there is a large and central Bommarito node on this graph.
Perils of Interdisciplinary Scholarship — Evading the Discipline Police?
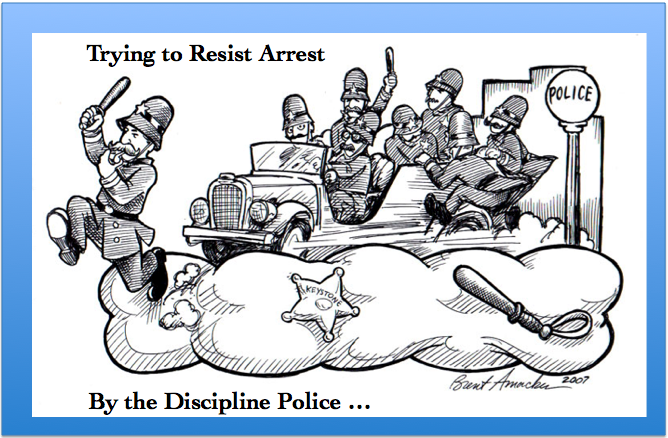
It is difficult to traverse the broad disciplinary landscape. We feel so fortunate to work with a community here at Michigan which is committed to resisting those who seek to restrict intellectual innovation–individuals we characterize as the disciplinary police. Since starting this blog, we have received several emails from legal, social and physical science scholars interested in intellectual exploration, intellectual diversity. We appreciate their encouragement and will proudly continue to privilege “exploration over exploitation.”
In that vein, we wanted to offer some of our favorite recent papers drawn from a wide variety disciplines….
FIVE PAPERS FROM VARIOUS DISCIPLINES WE WANT TO HIGHLIGHT:
Gergely Palla, Albert-László Barabási & Tamás Vicsek, Quantifying Social Group Evolution, Nature 446: 664-667 (5 April 2007)
John Mikhail, Universal Moral Grammar: Theory, Evidence, and the Future, 11 Trends in Cognitive Sciences 143 (2007)
Jenna Bednar & Scott Page, Can Game(s) Theory Explain Culture? (The Emergence of Cultural Behavior Within Multiple Games), Rationality and Society, 19: 65-97 (2007).
Riley Crane & Didier Sornette (2008) Robust Dynamic Classes Revealed by Measuring the Response Function of a Social System, Proc. Nat. Acad. Sci. 105: 15649-15653.
Frans de Waal, Kristen Leimgruber & Amanda Greenberg (2008). Giving is Self-Rewarding for Monkeys. Proc. Nat. Acad. Sci. 105: 13685-13689.
The Revolution Will Not Be Televised — But Will it Come from HLS or YLS ? A Social Network Analysis of the Legal Academy (Part IV)
This is the final installment of posts related to Reproduction of Hierarchy? A Social Network Analysis of the American Law Professoriate. Thanks for your emails.
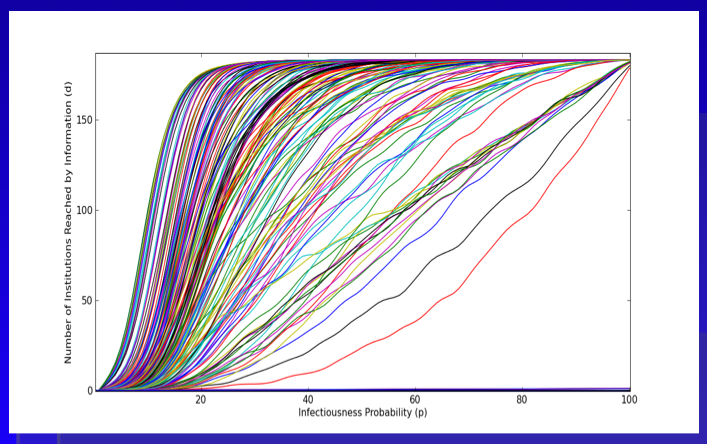
Here is the plot we provide within the paper. As a general proposition, we believe this represents an upper bound measure for the intellectual reach of an agenda offered by a given institution. With respect to our version of the Reed Frost Epidemiological Model, we use the p parameter to model “idea infectiousness.” When p = 1 every institution “contacted” by the idea is infected with the idea. When p = 0 no institution “contacted” by the idea is infected. In this version, we use the programming language python to run the model 500 times per institution. The above plot represents an estimate of the “diffusion curve” for each of the 184 institutions in our model. Building off central limit type properties, this leaves a far better estimate of reach than is offered in the single model run from the previous Netlogo GUI.
A cursory review of the above plot demonstrates, we are far from the land of linearity. Namely, a large number of institutions are able to reach much of the graph with very small changes in the value of p.
In the Structure of Scientific Revolutions, Kuhn quotes from Max Planck: “a new scientific truth does not triumph by convincing its opponents and making them see the light, but rather because its opponents eventually die, and a new generation grows up that is familiar with it.” Following Planck, we believe retirement is indeed be an important mechanism. However, we also argue the nature of the p parameter is a relevant consideration. In fact, unpacking various dimensions of p is the key to the broader model. Specifically, what are the properties of an idea that generate its infectiousness? Of course, we might like to believe infectiousness is related to a class of normatively attractive properties such as promoting efficiency or justice. However, it is not clear that this follows.
We took no pass on the question of whether some institutions would be better or worse at producing ideas with greater or lesser values of p. The motivated question for this post considers whether, in general, the institutions which are top producers of law professors are (1) leaders in innovation, (2) subsequent ratifiers of a newly established paradigm or (3) defenders of the status quo. In a deep sense, we are asking how to reasonably model decision making by the heterogeneous agents located at such institutions. Do institutions reward or punish intellectual risk-taking, search, etc.?
While this is an empirical question beyond the scope of this post, it worth asking because it partially informs the micro-dynamics plausibly responsible for generating the spread of new intellectual paradigms.

