Click on the above picture and you will be taken to the Interactive Gallery of Computational Legal Studies. Once inside the gallery, click on any thumbnail to see the full size image. Each image features a link to supporting materials such as documentation and/or the underlying academic paper. We hope to add more content to gallery over the coming weeks and months — so please check back! Please note that load time may vary depending upon your connection, machine, etc.
Tag: network analysis
NetSci 2010 — MIT Media Lab
Tomorrow is the first day of presentations at NetSci2010. Our paper will presented in AM Network Measures Panel. Anyway, for those interested in leveraging network science to study the dynamics of large social and physical systems — the conference promises a fantastic lineup of speakers. Check out the program!
Computational Legal Studies Presentation Slides from the Law.gov Meetings
Thanks to Carl Malamud and the good folks at the University of Colorado Law School and University of Texas Law School for allowing us to participate in their respective law.gov meetings. For those interested in governmental transparency, we believe that Carl Malamud’s on-going national conversation is very important. The video above represents a fixed spaced movie combining the majority of the slides we presented at the two meetings. If the video will not load, click here to access the YouTube Version of the Slides. Enjoy!
Visualizing Temporal Patterns in the United States Supreme Court’s Network of Citations
The above image is a visualization of temporal citation patterns in the history of the United States Supreme Court. Each case is placed horizontally across the image in chronological order. We then draw citations between cases as curved arcs. We use three distinct arc colors to show qualitative differences between these citations:
- RED arcs correspond to citations within a natural court (e.g., the Rehnquist court citing the Rehnquist court).
- GREEN arcs correspond to citations from one natural court to the previous natural court (e.g., the Rehnquist court citing the Burger court).
- BLUE arcs correspond to citations from one natural court to a natural court prior to the previous natural court (e.g., the the Rehnquist court citing the Marshall court).
- Note that yellow is produced when red and green overlap.
Though there are many ways to interpret this data, we wanted to provide three simple conclusions to draw:
- The number of cases decided within each natural court varies dramatically. For instance, the Rehnquist court decided fewer cases than the Fuller court.
- Most citations are to recent cases, not cases in the distant past.
- The Burger and Rehnquist courts rely heavily on cases from the Hughes, Stone, and Vinson courts
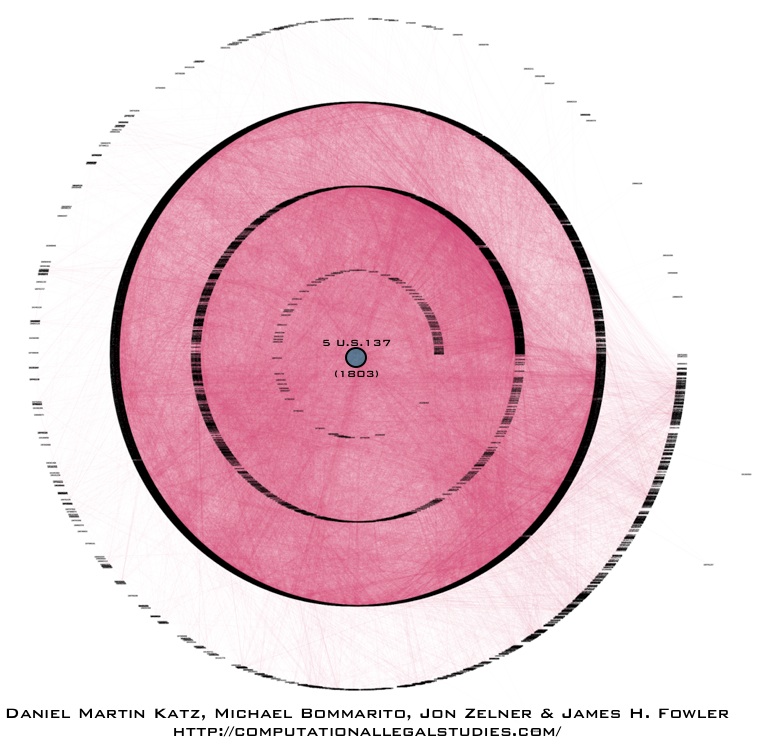
Six Degrees of Marbury v. Madison : A Sink Based Visualization
The visualization above is something we call “six degrees” of Marbury v. Madison. It was originally produced for use in our paper Distance Measures for Dynamic Citation Networks. Due to space considerations, we ended up leaving it on the cutting room floor. However, the visual is designed to highlight the idea of a “sink.”
Sinks are one of the core concepts which we outline in our Distance Measures for Dynamic Citation Networks paper. Looking through the prism of a citation network, sinks are the root to which a given legal concept, academic idea or patent based innovation can be drawn. From each citation in a non-sink node, it is possible to trace the chains of citations back to their root (which we call a sink). In the visualization above, the root or sink node is the famed United States Supreme Court decision Marbury v. Madison. Starting from the center and working out to the edge, the first ring are cases that directly cite Marbury v. Madison. The next ring are cases which cite cases that cite Marbury v. Madison. The next ring are cases which cite cases which cases that cite Marbury v. Madison and so on…
Anyway, one of the major contributions of the Distance Measures for Dynamic Citation Networks paper is that it allows us to use these sinks to create pairwise distance/similarity measure between the ith and jth unit. In this instance, the units in this directed acyclic network are the ith and jth decisions of the United States Supreme Court.
Now, it is important to note cases contain many citations and thus can be oriented relative to many different sinks. So, even if a case can be traced to the Marbury sink – this does not preclude it from being traced to other sinks as well. Also, it is possible to design many mathematical functions to characterize the sink based distance between units. For instance, the importance of a sink might decay as its shortest path length increases. An alternative measure might weight the importance of each sinks by the number of unique ancestors shared between nodes i and j that are descended from a given sink of interest. Indeed, many fine-grained choices are possible but they require justification drawn from the given substantive problem …
Bursts: The Hidden Pattern Behind Everything We Do
Albert-László Barabási, in his usual creative fashion, has produced an interesting game to help publicize his new book, Bursts: The Hidden Pattern Behind Everything We Do.
Read their description of the game below and check it out if you’re interested!
BuRSTS is a performance in human dynamics, a game of cooperation and prediction, that will gradually unveil the full text of Bursts. In a nutshell, if you register at http://brsts.com, you will be able to adopt one of the 84,245 words of the book. Once you adopt, the words adopted by others will become visible to you — thus as each words finds a parent, the whole book will become visible to the adopters. But if you invite your friends (and please do!) and you are good at predicting hidden content, the book will unveil itself to you well before all words are adopted. We will even send each day free signed copied of Bursts to those with the best scores.
Gregory Todd Jones — Evolution of Complexity and “Rethinking Individuality” at TedX Atlanta
As a member of the Society for Evolutionary Analysis in Law (SEAL), I have had the oppurtunity to see a number of interesting presentations by Gregory Todd Jones. Gregory is a Faculty Research Fellow and Adjunct Professor of Law at the Georgia State University College of Law as well as Senior Director of Research and Principal Scientist at the Network for Collaborative Problem Solving. Of particular interest to readers of this blog, he is also the founding director of the Computational Laboratory for Complex Adaptive Systems at Georgia State Law School.
Above is a recent talk by Gregory at the TedX Atlanta in which he (1) assembles a model of sustainability based on collaboration and (2) discusses species behavior … from slugs to chimpanzees. If you are interested in learning more … Gregory has launched a really cool blog … Cooperation Science Blog … Check it out!
On the Stability of Community Detection Algorithms on Longitudinal Citation Data: Paper & New Code
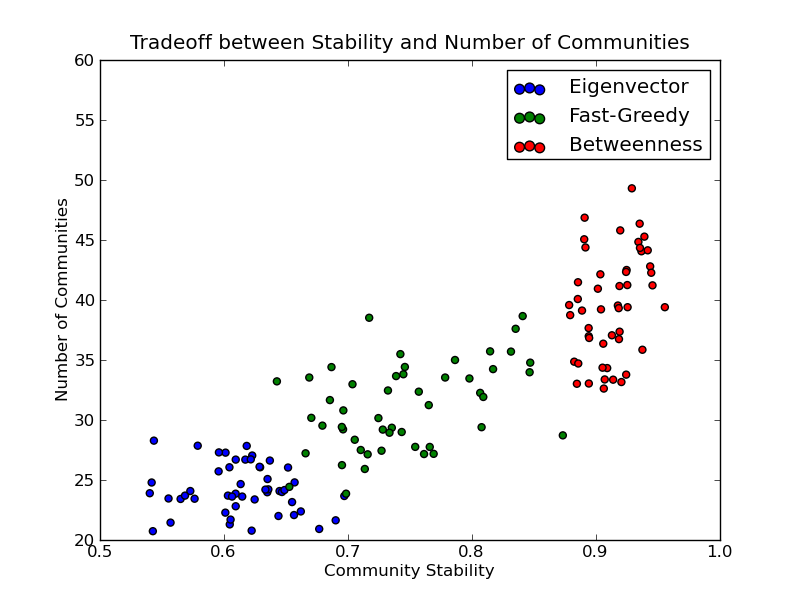
Last summer, Dan, Jon and I wrote our conference paper for ASNA 2009 entitled On the Stability of Community Detection Algorithms on Longitudinal Citation Data. The purpose of this paper was to experimentally explore a number of properties of community detection algorithms, especially as applied to citation networks (c.f. Supreme Court, Tax Court, United States Code).
The model is a fairly simple discrete-time directed growing graph. At time 0, we create a completely disconnected graph with some initial number of vertices. The number of new vertices after time 0 is then modeled by a homogeneous Poisson process. For each of these new vertices, we also model the number of edges per vertex as IID Poisson distributions. The probability distribution over these edges is specified by a modified preferential attachment mechanism.
Most of our questions consider what we’ve called the average pairwise stability. This can be thought of as answering the following question: “what is the probability that Alice and Bob are friends tomorrow if they were friends today?” Here, friendship corresponds to sharing the same community. By asking this question for all pairs of vertices (dyads) for all time steps in which both vertices existed, we get a probability that a community dyad is preserved from step to step. It is important to note that we’re not claiming all algorithms applied to all systems should have high average pairwise stability. In fact, for systems that involve dynamics like random rewiring, the only way to get high pairwise stability is to put all vertices in the same community or their own community at all steps – obviously trivial and unhelpful solutions in practice.
Given this model and this conception of stability, we want to perform the following experiments:
- How do the edge-betweenness, fast greedy, and leading eigenvector community detection algorithms compare in terms of their average pairwise stability…
- for varying levels of preferential attachment?
- for varying vertex and edge rates?
- Is there a significant tradeoff between the number of communities and the average pairwise stability of these community detection algorithms?
The answers are yes, yes, and yes! You should read the paper for more details.
I’ve also produced some code to help you assess the average pairwise stability for your dataset. The code requires igraph and is only in Python at this point due to an issue with R’s vertex label handling (which I can hopefully work around). You can get the average pairwise stability methods on github and check out the example below:
The Development of Structure in the Citation Network of the United States Supreme Court — Now in HD!

What are some of the key takeaway points?
(1) The Supreme Court’s increasing reliance upon its own decisions over the 1800-1830 window.
(2) The important role of maritime/admiralty law in the early years of the Supreme Court’s citation network. At least with respect to the Supreme Court’s citation network, these maritime decisions are the root of the Supreme Court’s jurisprudence.
(3) The increasing centrality of decisions such as Marbury v. Madison, Martin v. Hunter’s Lessee to the overall network.
The Development of Structure in the SCOTUS Citation Network
The visualization offered above is the largest weakly connected component of the citation network of the United States Supreme Court (1800-1829). Each time slice visualizes the aggregate network as of the year in question.
In our paper entitled Distance Measures for Dynamic Citation Networks, we offer some thoughts on the early SCOTUS citation network. In reviewing the visual above note ….“[T]he Court’s early citation practices indicate a general absence of references to its own prior decisions. While the court did invoke well-established legal concepts, those concepts were often originally developed in alternative domains or jurisdictions. At some level, the lack of self-reference and corresponding reliance upon external sources is not terribly surprising. Namely, there often did not exist a set of established Supreme Court precedents for the class of disputes which reached the high court. Thus, it was necessary for the jurisprudence of the United States Supreme Court, seen through the prism of its case-to-case citation network, to transition through a loading phase. During this loading phase, the largest weakly connected component of the graph generally lacked any meaningful clustering. However, this sparsely connected graph would soon give way, and by the early 1820’s, the largest weakly connected component displayed detectable structure.”
What are the elements of the network?
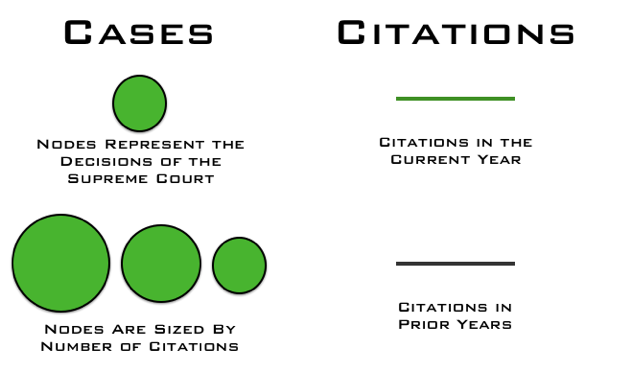
What are the labels?
To help orient the end-user, the visualization highlights several important decisions of the United States Supreme Court offered within the relevant time period:
Marbury v. Madison, 5 U.S. 137 (1803) we labeled as ”Marbury”
Murray v. The Charming Betsey, 6 U.S. 64 (1804) we labeled as “Charming Betsey”
Martin v. Hunter’s Lessee, 14 U.S. 304 (1816) we labeled as “Martin’s Lessee”
The Anna Maria, 15 U.S. 327 (1817) we labeled as “Anna Maria”
McCulloch v. Maryland, 17 U.S. 316 (1819) we labeled as “McCulloch”
Why do cases not always enter the visualization when they are decided?
As we are interested in the core set of cases, we are only visualizing the largest weakly connected component of the United States Supreme Court citation network. Cases are not added until they are linked to the LWCC. For example, Marbury v. Madison is not added to the visualization until a few years after it is decided.
How do I best view the visualization?
Given this is a high-definition video, it may take few seconds to load. We believe that it is worth the wait. In our view, the video is best consumed (1) Full Screen (2) HD On (3) Scaling Off.
Where can I find related papers?
Here is a non-exhaustive list of related scholarship:
Michael Bommarito, Daniel Katz, Jon Zelner & James Fowler, Distance Measures for Dynamic Citation Networks, Physica A __ (2010 Forthcoming).
Yonatan Lupu & James Fowler, The Strategic Content Model of Supreme Court Opinion Writing, APSA 2009 Toronto Meeting Paper.
Michael Bommarito, Daniel Katz & Jon Zelner, Law as a Seamless Web? Comparison of Various Network Representations of the United States Supreme Court Corpus (1791-2005) in Proceedings of the 12th Intl. Conference on Artificial Intelligence and Law (2009).
Frank Cross, Thomas Smith & Antonio Tomarchio, The Reagan Revolution in the Network of Law, 57 Emory L. J. 1227 (2008).
James Fowler & Sangick Jeon, The Authority of Supreme Court Precedent, 30 Soc. Networks 16 (2008).
Elizabeth Leicht, Gavin Clarkson, Kerby Shedden & Mark Newman, Large-Scale Structure of Time Evolving Citation Networks, 59 European Physics Journal B 75 (2007).
Thomas Smith, The Web of the Law, 44 San Diego L.R. 309 (2007).
James Fowler, Timothy R. Johnson, James F. Spriggs II, Sangick Jeon & Paul J. Wahlbeck, Network Analysis and the Law: Measuring the Legal Importance of Precedents at the U.S. Supreme Court, 15 Political Analysis, 324 (2007).
_
The Development of Structure in the Citation Network of the United States Supreme Court
The Development of Structure in the Citation Network of the United States Supreme Court — Now in HD! from Computational Legal Studies on Vimeo.
What are some of the key takeaway points?
(1) The Supreme Court’s increasing reliance upon its own decisions over the 1800-1830 window.
(2) The important role of maritime/admiralty law in the early years of the Supreme Court’s citation network. At least with respect to the Supreme Court’s citation network, these maritime decisions are the root of the Supreme Court’s jurisprudence.
(3) The increasing centrality of decisions such as Marbury v. Madison, Martin v. Hunter’s Lessee to the overall network.
The Development of Structure in the SCOTUS Citation Network
The visualization offered above is the largest weakly connected component of the citation network of the United States Supreme Court (1800-1829). Each time slice visualizes the aggregate network as of the year in question.
In our paper entitled Distance Measures for Dynamic Citation Networks, we offer some thoughts on the early SCOTUS citation network. In reviewing the visual above note ….“[T]he Court’s early citation practices indicate a general absence of references to its own prior decisions. While the court did invoke well-established legal concepts, those concepts were often originally developed in alternative domains or jurisdictions. At some level, the lack of self-reference and corresponding reliance upon external sources is not terribly surprising. Namely, there often did not exist a set of established Supreme Court precedents for the class of disputes which reached the high court. Thus, it was necessary for the jurisprudence of the United States Supreme Court, seen through the prism of its case-to-case citation network, to transition through a loading phase. During this loading phase, the largest weakly connected component of the graph generally lacked any meaningful clustering. However, this sparsely connected graph would soon give way, and by the early 1820’s, the largest weakly connected component displayed detectable structure.”
What are the elements of the network?
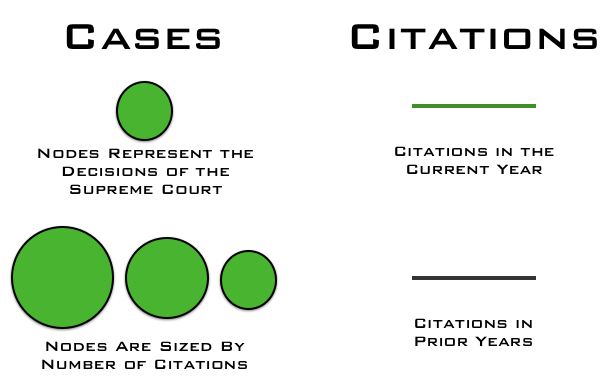
What are the labels?
To help orient the end-user, the visualization highlights several important decisions of the United States Supreme Court offered within the relevant time period:
Marbury v. Madison, 5 U.S. 137 (1803) we labeled as “Marbury”
Murray v. The Charming Betsey, 6 U.S. 64 (1804) we labeled as “Charming Betsey”
Martin v. Hunter’s Lessee, 14 U.S. 304 (1816) we labeled as “Martin’s Lessee”
The Anna Maria, 15 U.S. 327 (1817) we labeled as “Anna Maria”
McCulloch v. Maryland, 17 U.S. 316 (1819) we labeled as “McCulloch”
Why do cases not always enter the visualization when they are decided?
As we are interested in the core set of cases, we are only visualizing the largest weakly connected component of the United States Supreme Court citation network. Cases are not added until they are linked to the LWCC. For example, Marbury v. Madison is not added to the visualization until a few years after it is decided.
How do I best view the visualization?
Those interested in viewing the full screen video—click on the full screen icon contained in the Vimeo bottom banner. Check out the NEW Hi-Def (HD) version of the video!
GraphMovie: A Library for Generating Movies from Dynamic Graphs with igraph
Over the past few months, we’ve developed a library for simply generating dynamic network animations. We’ve used this library in visualizations like (1) Visualizing the Gawaher Interactions of Umar Farouk Abdulmutallab, the Christmas Day Bomber and (2) Dynamic Animation of the East Anglia Climate Research Unit Email Network. Prior to these visualizations, we’ve used Sonia to produce animations like this one. While certainly a useful program for those without programming expertise, Sonia suffers from a number of issues that make it unusable for large graphs or graphs with many “slices.” Furthermore, in our experience rendering various movies a number of platform issues with the Quicktime and Flash rendering engines have arisen. Fixing these problems is possible, but Sonia’s large Java codebase makes for a steep learning curve. As a result, we’ve decided to release this GraphMovie class so that others can use or possibly improve this library.
In order to use the GraphMovie, you’ll need the following:
- python (tested with 2.6)
- igraph for network manipulation and visualization
- Python Imaging Library for manipulating the image frames
- mencoder from the MPlayer package for encoding the image frames into a movie
Here are the files, hosted on github:
GraphMovie: Example 1 from Computational Legal Studies on Vimeo.
GraphMovie: Example 2 from Computational Legal Studies on Vimeo.
Visualizing the Gawaher Interactions of Umar Farouk Abdulmutallab, the Christmas Day Bomber
Based on the Farouk1986 Gawaher data posted earlier this week, we have analyzed the communication network of the alleged Christmas Day Bomber, Umar Farouk Abdulmutallab.
Using the handle “Farouk1986,” Abdulmutallab was a regular participant on the Islamic forum Gawaher.com. Several years prior to the Christmas Day incident, the alleged Christmas Day Bomber took part in a significant number of communications. Of course, these communications can be analyzed in a number of ways. For example, over at Zero Intelligence Agents, Drew Conway has already done some useful initial analysis. We sought to contribute our analysis of the time-evolving communication network contained within these posts. While more extensive documentation is available below, in reviewing the dynamic network visualization, consider the following observations:
Click on the Full Screen Button! (4 Arrow Symbol in the Vimeo Bottom Banner)
#1) “Farouk1986” Entered an Existing Network Which Appeared to Increase the Salience of Religion in His Life
Although individuals in society may feel isolated or appear to be loners, the internet offers like minded, potentially meaningful networks of people with whom to connect. These internet is full of communities of individuals who interests are wide ranging—including topics such as Blizzard’s World of Warcraft, sports, culinary interests or religion. With whatever prior beliefs he held, “Farouk1986” entered this subset of the broader Islamic online community in late 2004. While it is not possible for us to make definitive conclusions, it appears that the community with whom he connected increased the salience of religion in his life. In other words, through the internet “Farouk1986” experienced a reinforcing feedback and this likely primed him for further radicalization.
#2) The Network of “Farouk1986” Grows Increasingly Stable Once Established
“Farouk1986” increasingly communicated with the same set of individuals over the window in question. Thus, while communication continued to flow through the network … the network, once established, remains fairly stable. In other words, instead of being exposed to diverse sets of individuals, “Farouk1986” continued to communicate with the same individuals. In turn, those direct contacts also continued to communicate with the same individuals.
#3) Additional Streams of Data Would Enhance Analysis
The forum posts which serve as the data for this analysis are only a subset of the communication network experienced by Umar Farouk Abdulmutallab. Additional streams of relevant data would include phone records, emails, participation in other forums, etc. would likely enhance the granularity of our analysis. If you have access to such data and are legally authorized to share it-please feel free to contact us.
Background
For those not already familar with the case, Umar Farouk Abdulmutallab is charged with willful attempt to destroy an aircraft in connection with the December 25, 2009 Delta Flight 253 from Amsterdam to Detroit. Like many, we wondered precisely what path led the son of a wealthy banker to find himself as a would be suicide bomber. While these communications represent only a small portion of the broader picture, a number of illuminating analyses can still be conducted using this available information.
Using the handle “Farouk1986,” Umar Farouk Abdulmutallab was a regular participant on the popular Islamic forum Gawaher.com. Thus, as a small contribution to the broader analysis of the Christmas Day Incident, we have generated a basic visualization and analysis of the time-evolving structure of the Farouk1986 online communication network.
Filtration of the Gawaher.com Forum
As a major Islamic forum, Gawaher.com features a tremendous number of participants and a wide range of post on topics including Islamic culture, religion, international football, politics, etc.
Given our specific interest in the online behavior of Umar Farouk Abdulmutallab, we were most interested in analyzing the direct and indirect communication network associated with the handle “Farouk1986” (aka Umar Farouk Abdulmutallab). Therefore, it was necessary to filter the broader universe of communication on Gawaher.com to the relevant subset.
A portion of this information is contained in publically available NEFA dataset. While useful, we determined that this dataset alone did not include the information necessary for us to construct the Farouk1986 secondary/indirect communications network. In order to obtain a better understanding of this communication network, we retrieved every “topic” in which Farouk1986 participated at least once. Each “topic” is comprised of one or more “posts” from one or more users. Each “post” may be in response to another user’s “post.” The NEFA data contains only posts made by Farouk1986 – our data contains the entire context within which his posts existed.
Building the Time-Evolving Network of Direct and Indirect Communications
Building from this underlying data, we sought to both visualize and analyze the time evolving structure of the “Farouk1986” communication network. For those not familiar with network visualization and analytic techniques—networks consist of both nodes and edges.
In the animation offered above, each “node” is an author. The labels of all best the most central authors have been removed for visibility purposes. Each “edge” is a weighted connection between two authors, where the weight is the strength of connection between each individual. Thus, within the communication network, thicker edges represent more communications while thinner edges reflect fewer communications.
In the visualization, you will notice most nodes are colored black. For purposes of ocular differentiation, the Farouk1986 node is colored red. In addition, we color direct communications with Farouk1986 in red and communications not directly involving Farouk1986 in black.
Given each forum post is datestamped, we can order the network such that the animation reflects the changing composition of the Farouk1986 online communication network. The datestamp is reflected in the upper left corner of animation. Our analysis is limited to the 2004-2005 time period when Farouk1986 was a regular participant.
The network is visualized in each time step using the Kamada-Kawai Visualization Algorithm. Kamada-Kawai is spring embedded force directed placement algorithm commonly used to visualize networks similar to the one considered herein. In order to smooth the visual while not undercutting the qualitatively results, we apply linear interpolation between frames.
10 Most Central Participants in the Farouk1986 Network
The following are the ten most central participants in the network, as measured by weighted eigenvector centrality:
| Author | Centrality |
| Crystal Eyes | 1 |
| property_of_allah | 0.84 |
| Farouk1986 | 0.81 |
| amani | 0.69 |
| Mansoor Ansari | 0.61 |
| sis Qassab | 0.55 |
| muslim mujahid | 0.49 |
| Arwa | 0.43 |
| sister in islam | 0.31 |
| Anj | 0.29 |
Directions for Additional Analysis
(a) Computational Linguistic Analysis of the Underlying Posts
Over what substantive dimensions did these networks of direct and indirect communication form?
(b) Recursive Growth of the Network
Friends-Friends-Friends and so on….
(c) Complete Analysis of the Gawaher.com Forum
Were the patterns of communications by Farouk1986 noticeably different from other forum participants?
(d) Linkage of Content and Structure
What is the nature of information diffusion across the Gawaher.com?
How did this differ by substantive topic?
Dynamic Animation of the East Anglia Climate Research Unit Email Network
FULL SCREEN FOR BETTER VIEWING!
Click on this icon to view the Movie in Full Screen Mode!![]()
STATIC SNAPSHOT TO DYNAMIC ANIMATION
In our prior post analyzing the email database of Climate Research Unit at the University of East Anglia, we aggregated all emails over the relevant 1997-2009 time period into a single static visualization. Specifically, to build the network, we processed every email in the leaked data. Each email contains a sender and at least one recipient on the To:, Cc:, or Bcc: line.
One obvious shortcoming associated with producing a static snapshot for data set, is that it often obscures the time evolving dynamics of interaction which produced the full graph. To generate a dynamic picture, it is necessary to collect time stamped network data. In the current case, this required acquisition of the date field for each of the emails. With this information, we used the same underlying data to generate a dynamic network animation for the 1997-2009 time window.
HOW TO INTERPET THE MOVIE
Consistent with the approach offered in our prior visualization, each node represents an individual within the email dataset while each connection reflects the weighted relationship between those individuals. The movie posted above features the date in the upper left. As time ticks forward, you will notice that the relative social relationships between individuals are updated with each new batch of emails. In some periods, this updating has significant impact upon the broader network topology and at other time it imposes little structural consequences.
In each period, both new connections as well as new communications across existing connections are colored teal while the existing and dormant relationships remain white. Among other things, this is useful because it identifies when a connection is established and which interactions are active at any given time period.
A SHORT VERSION AND A LONG VERSION
We have two separate versions of the movie. The version above is a shorter version where roughly 13 years is displayed in under 2 minutes. In the coming days, we will have a longer version of the movie which ticks a one email at a time. In both versions, each frame is rendered using the Kamada-Kawai layout algorithm. Then, the frames are threaded together using linear interpolation.
SELECTION EFFECTS
Issues of selection of confront many researchers. Namely, given the released emails are only a subset of the broader universe of emails authored over the relevant time window, it is important to remember that the data has been filtered and the impact of this filtration can not be precisely determined. Notwithstanding this issue, our assumption is that every email from a sender to a recipient represents a some level of relationship between them. Furthermore, we assume that more emails sent between two people generally indicates a stronger relationship between those individuals.
DIMENSIONALITY
In our academic scholarship, we have confronted questions of dimensionality in network data. Simply put, analyzing network data drawn from high dimensional space can be really thorny. In the current context, a given email box likely contains emails on lots of subjects and reflects lots of people not relevant to the specific issue in question. Again, while we do not specifically know the manner in which the filter was applied, it is certainly possible that the filter actually served to mitigate issues of dimensionality.
ACCESS THE DATA
For those interested in searching the emails, the NY Times directs the end user to http://www.eastangliaemails.com/

