
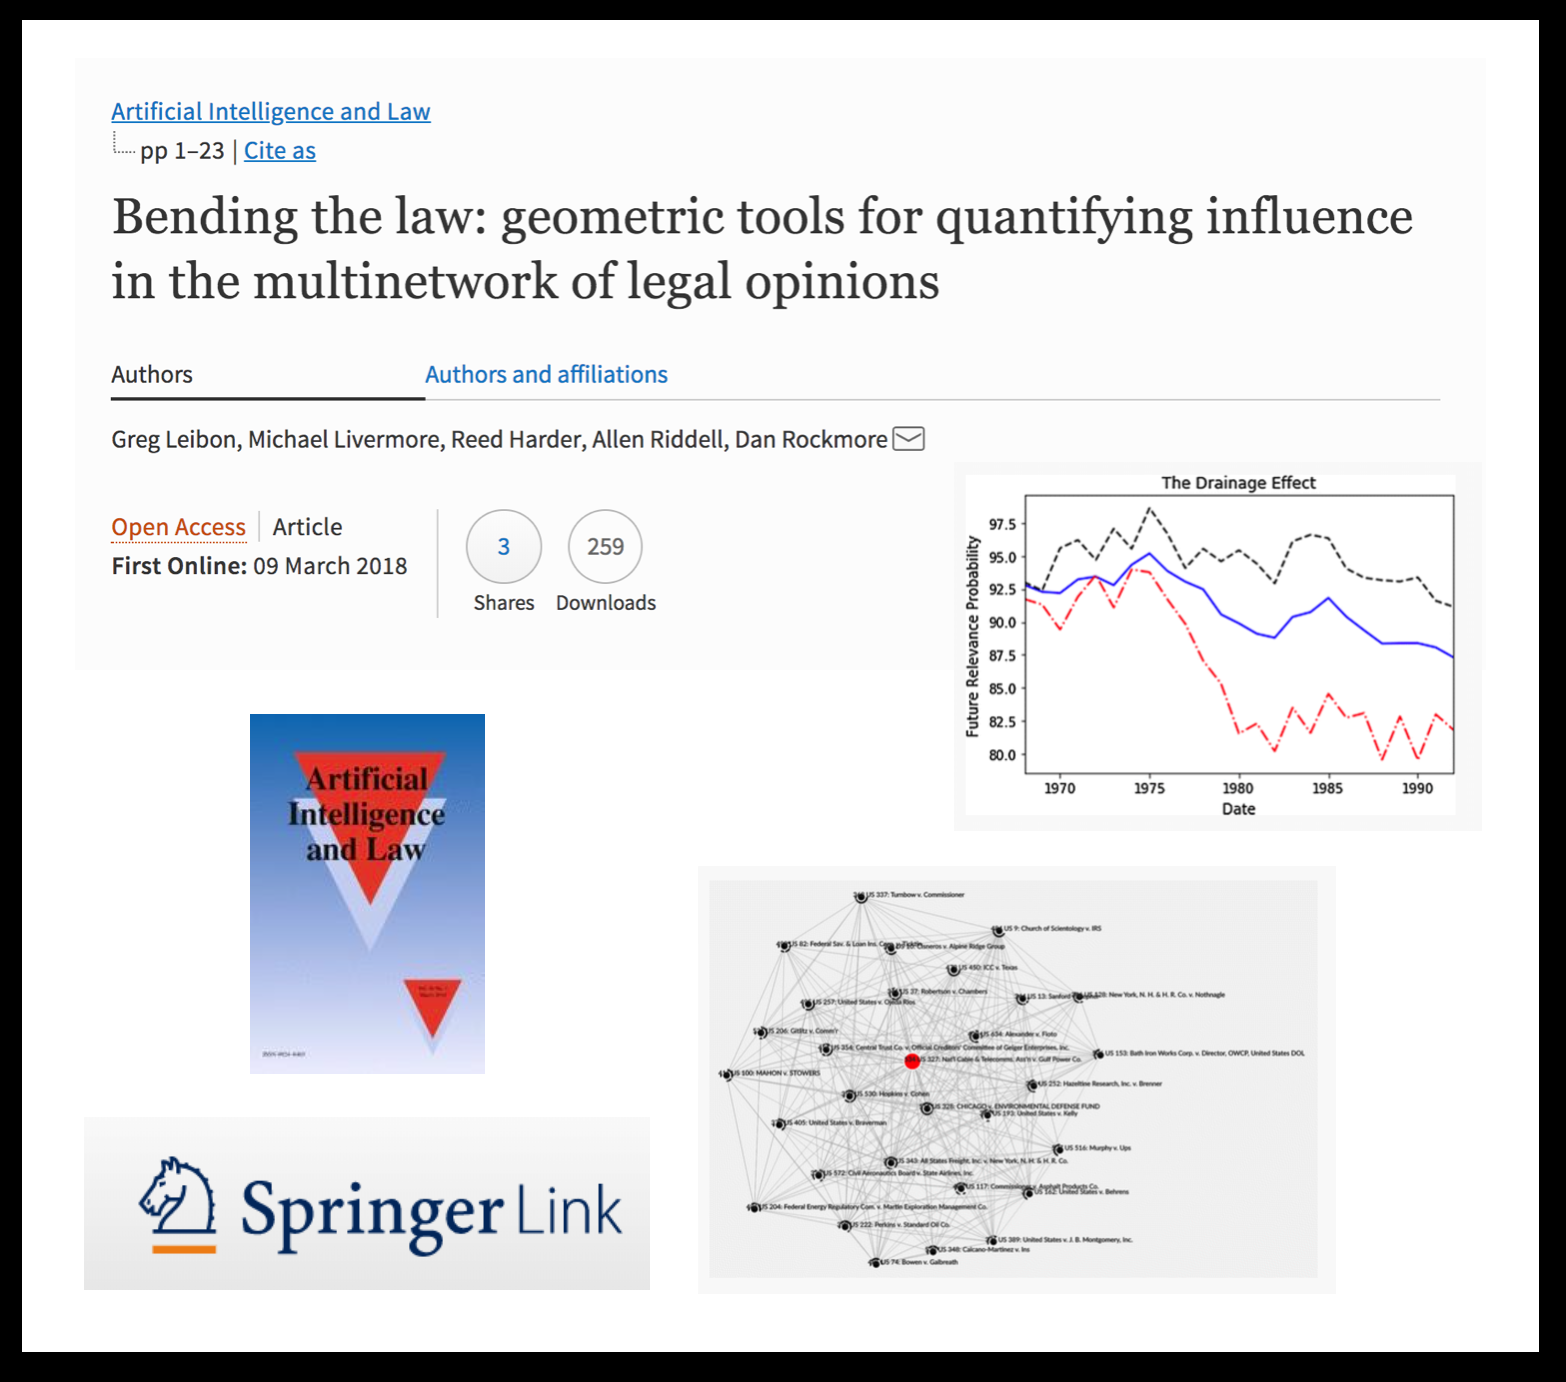
This is a very interesting Net Sci + Law Paper !
Tag: judicial citation network
Research Methods in Constitutional Law Conference – Oslo 2017
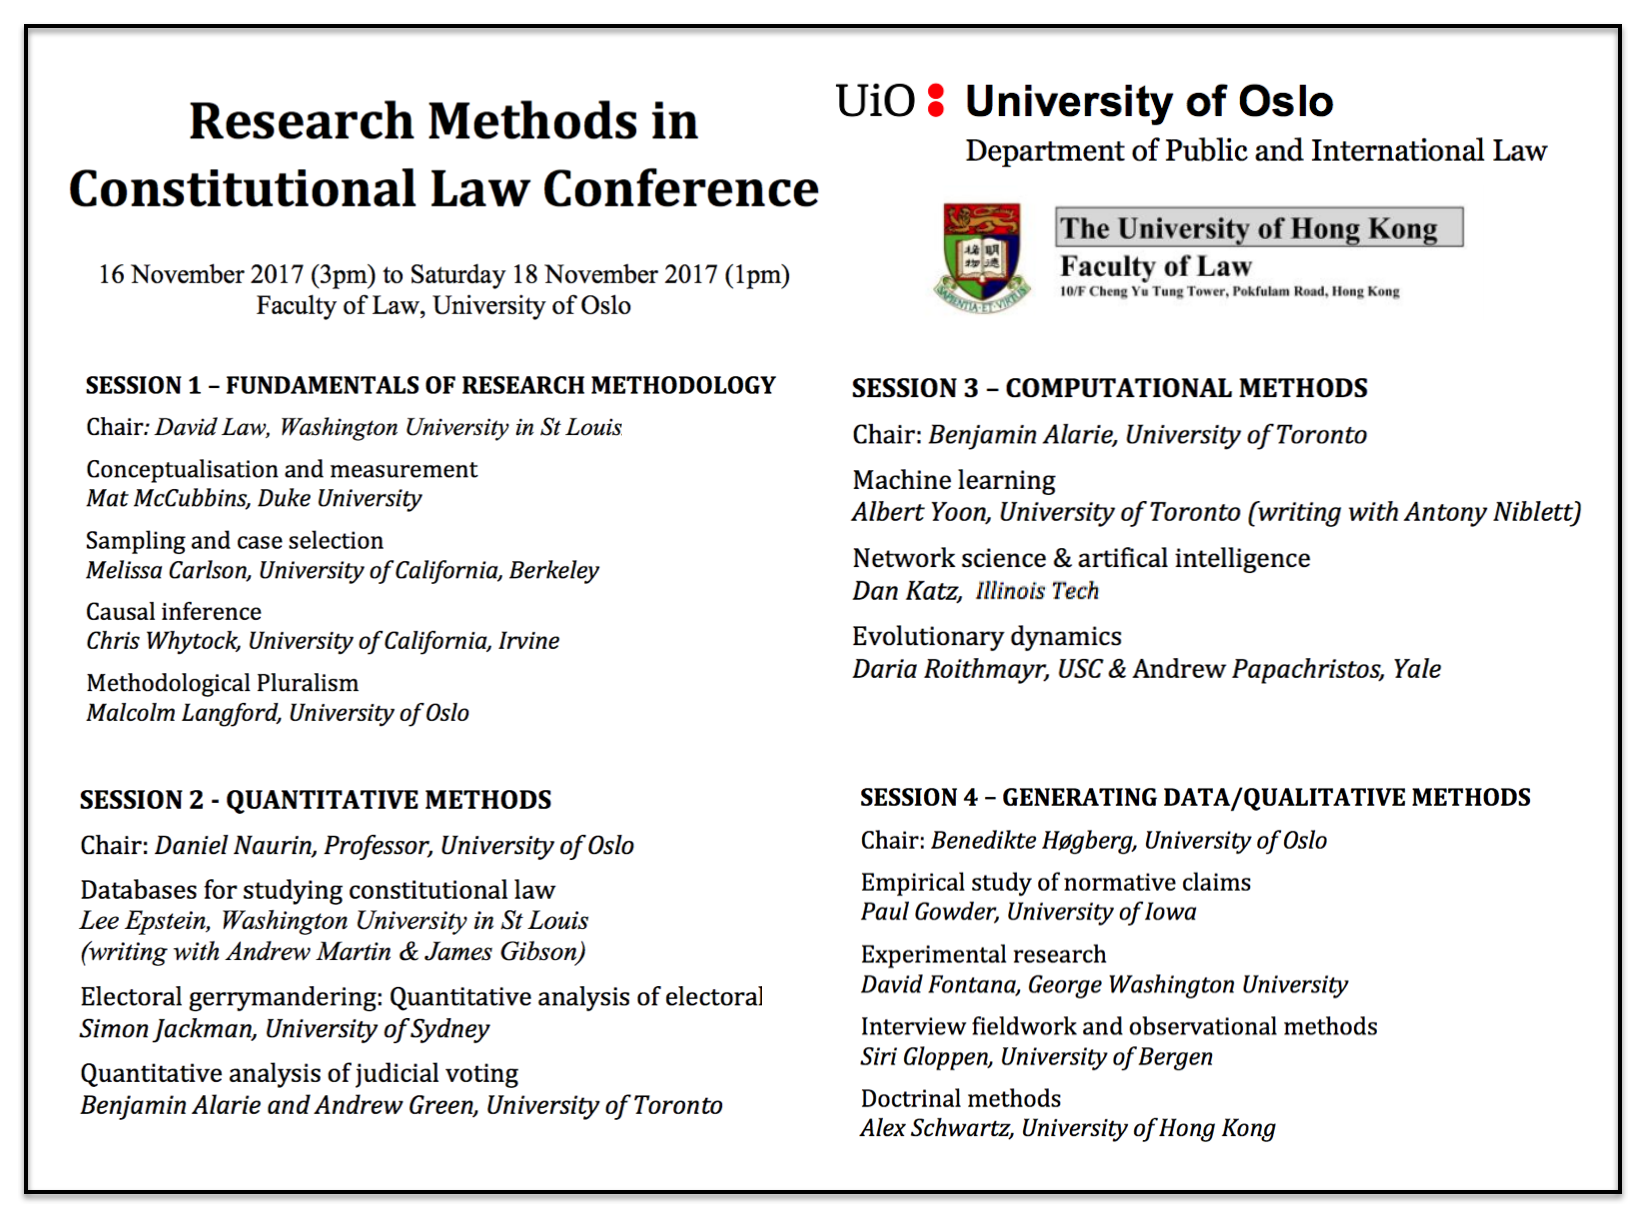 I do not speak at many (any) con law themed events but I am happy to be part of this conversation as it is related to making con law a more scientifically inclined field of human endeavor. #Science #LegalScience #Hashtag
Teaching the Complex Systems Course @ University of Michigan ICPSR Summer Program in Quantitative Methods
 This upcoming week and next week I have the pleasure of teaching “Complex Systems Models in the Social Sciences” here at the University of Michigan ICPSR Summer Program in Quantitative Methods. The field of complex systems is very diverse and it is difficult to do complete justice to the range of scholarship conducted under this umbrella in a short survey course. However, we strive to cover the canonical topics such as computational game theory and computational modeling, network science, natural language processing, randomness vs. determinism, diffusion, cascades, emergence, empirical approaches to study complexity (including measurement), social epidemiology, non-linear dynamics, etc. Click here or on the image above to access my course materials!
Network Analysis and the Law — 3D-Hi-Def Visualization of the Time Evolving Citation Network of the United States Supreme Court
What are some of the key takeaway points?
(1) The Supreme Court’s increasing reliance upon its own decisions over the 1800-1830 window.
(2) The important role of maritime/admiralty law in the early years of the Supreme Court’s citation network. At least with respect to the Supreme Court’s citation network, these maritime decisions are the root of the Supreme Court’s jurisprudence.
(3) The increasing centrality of decisions such as Marbury v. Madison, Martin v. Hunter’s Lessee to the overall network.
The Development of Structure in the SCOTUS Citation Network
The visualization offered above is the largest weakly connected component of the citation network of the United States Supreme Court (1800-1829). Each time slice visualizes the aggregate network as of the year in question.
In our paper entitled Distance Measures for Dynamic Citation Networks, we offer some thoughts on the early SCOTUS citation network. In reviewing the visual above note ….“[T]he Court’s early citation practices indicate a general absence of references to its own prior decisions. While the court did invoke well-established legal concepts, those concepts were often originally developed in alternative domains or jurisdictions. At some level, the lack of self-reference and corresponding reliance upon external sources is not terribly surprising. Namely, there often did not exist a set of established Supreme Court precedents for the class of disputes which reached the high court. Thus, it was necessary for the jurisprudence of the United States Supreme Court, seen through the prism of its case-to-case citation network, to transition through a loading phase. During this loading phase, the largest weakly connected component of the graph generally lacked any meaningful clustering. However, this sparsely connected graph would soon give way, and by the early 1820’s, the largest weakly connected component displayed detectable structure.”
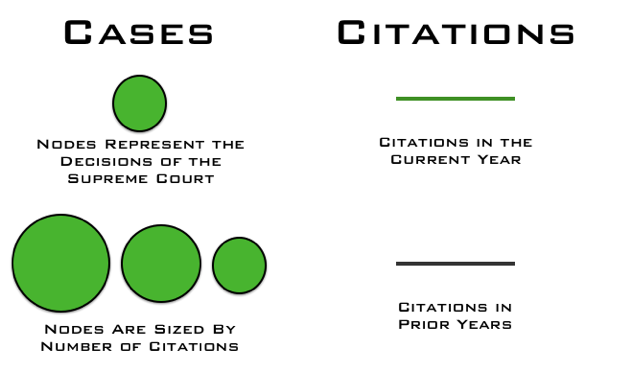
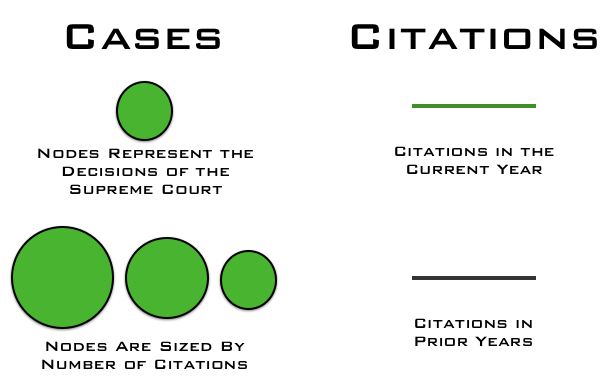
What are the elements of the network?
What are the labels?
To help orient the end-user, the visualization highlights several important decisions of the United States Supreme Court offered within the relevant time period:
Marbury v. Madison, 5 U.S. 137 (1803) we labeled as ”Marbury”
Murray v. The Charming Betsey, 6 U.S. 64 (1804) we labeled as “Charming Betsey” Martin v. Hunter’s Lessee, 14 U.S. 304 (1816) we labeled as “Martin’s Lessee”
The Anna Maria, 15 U.S. 327 (1817) we labeled as “Anna Maria”
McCulloch v. Maryland, 17 U.S. 316 (1819) we labeled as “McCulloch”
Why do cases not always enter the visualization when they are decided?
As we are interested in the core set of cases, we are only visualizing the largest weakly connected component of the United States Supreme Court citation network. Cases are not added until they are linked to the LWCC. For example, Marbury v. Madison is not added to the visualization until a few years after it is decided.
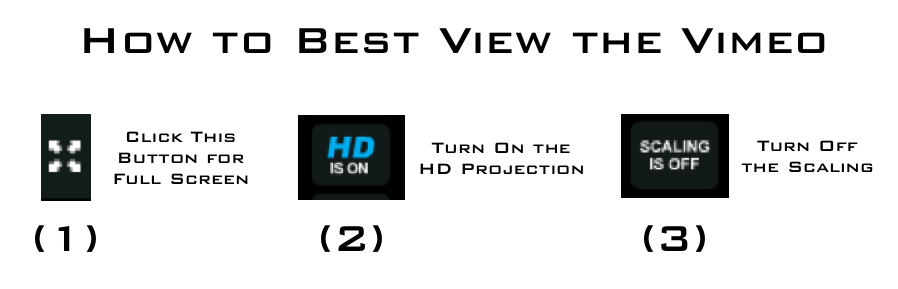
How do I best view the visualization?
Given this is a high-definition video, it may take few seconds to load. We believe that it is worth the wait. In our view, the video is best consumed (1) Full Screen (2) HD On (3) Scaling Off.
Where can I find related papers?
Here is a non-exhaustive list of related scholarship:
Daniel Martin Katz, Network Analysis Reveals the Structural Position of Foreign Law in the Early Jurisprudence of the United States Supreme Court (Working Paper – 2014)
Yonatan Lupu & James H. Fowler, Strategic Citations to Precedent on the U.S. Supreme Court, 42 Journal of Legal Studies 151 (2013)
Michael Bommarito, Daniel Martin Katz, Jon Zelner & James Fowler, Distance Measures for Dynamic Citation Networks, 389 Physica A 4201 (2010).
Michael Bommarito, Daniel Martin Katz & Jon Zelner, Law as a Seamless Web? Comparison of Various Network Representations of the United States Supreme Court Corpus (1791-2005) in Proceedings of the 12th Intl. Conference on Artificial Intelligence and Law (2009).
Frank Cross, Thomas Smith & Antonio Tomarchio, The Reagan Revolution in the Network of Law, 57 Emory L. J. 1227 (2008).
James Fowler & Sangick Jeon, The Authority of Supreme Court Precedent, 30 Soc. Networks 16 (2008).
Elizabeth Leicht, Gavin Clarkson, Kerby Shedden & Mark Newman, Large-Scale Structure of Time Evolving Citation Networks, 59 European Physics Journal B 75 (2007).
Thomas Smith, The Web of the Law, 44 San Diego L.R. 309 (2007).
James Fowler, Timothy R. Johnson, James F. Spriggs II, Sangick Jeon & Paul J. Wahlbeck, Network Analysis and the Law: Measuring the Legal Importance of Precedents at the U.S. Supreme Court, 15 Political Analysis, 324 (2007).
Network Analysis and Law Tutorial – Katz + Bommarito
Above is a tutorial that Mike and I developed for the Jurix Conference in Vienna in December of 2011. Feel free to message if I can answer any questions.
Network Analysis and Law Tutorial @ Jurix 2011 – Universität Wien

I am going to bump this post back to the top as a reminder – we look forward to seeing you at the Jurix 2011 Network Analysis and Law Tutorial …
“Prior to the 2011 Jurix Conference on Legal Knowledge and Information Systems, Professor Daniel Martin Katz (Michigan State University, College of Law) and Michael Bommarito (University of Michigan – Center for the Study of Complex Systems) will present a tutorial on Network Analysis and Law.
“While historically allied with fields such as mathematical sociology, developments in network science have been generated by a wide range of disciplines, with major recent contributions offered by fields such as applied mathematics and statistical physics. Applied graph theorists often refer to networks as dependency graphs because they formalize the underlying linkages between objects. Whether the objects in question are webpages on the internet, individuals in a social network such as Facebook or software dependencies in computer programming, the study of networks is the ‘science of our times.’
Building upon the developments in this interdisciplinary field, legal scholars and social scientists have recently begun to apply the tools of network science to bring new insight to a variety of long standing questions including the social structure of legal elites and the ‘evolution’ of the common law. This introductory tutorial is designed to help acquaint intellectually curious scholars with developments in this rapidly emerging field.”
Please join us in Vienna, Austria – December 13, 2011 @ Universität Wien for the Network Analysis and Law Tutorial as we help kick off Jurix 2011 Week.“

Computational Legal Studies – The Interactive Gallery

Click on the above picture and you will be taken to the Interactive Gallery of Computational Legal Studies. Once inside the gallery, click on any thumbnail to see the full size image. Each image features a link to supporting materials such as documentation and/or the underlying academic paper. We hope to add more content to gallery over the coming weeks and months — so please check back! Please note that load time may vary depending upon your connection, machine, etc.
Computational Legal Studies Presentation Slides from the Law.gov Meetings
Thanks to Carl Malamud and the good folks at the University of Colorado Law School and University of Texas Law School for allowing us to participate in their respective law.gov meetings. For those interested in governmental transparency, we believe that Carl Malamud’s on-going national conversation is very important. The video above represents a fixed spaced movie combining the majority of the slides we presented at the two meetings. If the video will not load, click here to access the YouTube Version of the Slides. Enjoy!
Visualizing Temporal Patterns in the United States Supreme Court’s Network of Citations

The above image is a visualization of temporal citation patterns in the history of the United States Supreme Court. Each case is placed horizontally across the image in chronological order. We then draw citations between cases as curved arcs. We use three distinct arc colors to show qualitative differences between these citations:
- RED arcs correspond to citations within a natural court (e.g., the Rehnquist court citing the Rehnquist court).
- GREEN arcs correspond to citations from one natural court to the previous natural court (e.g., the Rehnquist court citing the Burger court).
- BLUE arcs correspond to citations from one natural court to a natural court prior to the previous natural court (e.g., the the Rehnquist court citing the Marshall court).
- Note that yellow is produced when red and green overlap.
Though there are many ways to interpret this data, we wanted to provide three simple conclusions to draw:
- The number of cases decided within each natural court varies dramatically. For instance, the Rehnquist court decided fewer cases than the Fuller court.
- Most citations are to recent cases, not cases in the distant past.
- The Burger and Rehnquist courts rely heavily on cases from the Hughes, Stone, and Vinson courts
Six Degrees of Marbury v. Madison : A Sink Based Visualization

The visualization above is something we call “six degrees” of Marbury v. Madison. It was originally produced for use in our paper Distance Measures for Dynamic Citation Networks. Due to space considerations, we ended up leaving it on the cutting room floor. However, the visual is designed to highlight the idea of a “sink.”
Sinks are one of the core concepts which we outline in our Distance Measures for Dynamic Citation Networks paper. Looking through the prism of a citation network, sinks are the root to which a given legal concept, academic idea or patent based innovation can be drawn. From each citation in a non-sink node, it is possible to trace the chains of citations back to their root (which we call a sink). In the visualization above, the root or sink node is the famed United States Supreme Court decision Marbury v. Madison. Starting from the center and working out to the edge, the first ring are cases that directly cite Marbury v. Madison. The next ring are cases which cite cases that cite Marbury v. Madison. The next ring are cases which cite cases which cases that cite Marbury v. Madison and so on…
Anyway, one of the major contributions of the Distance Measures for Dynamic Citation Networks paper is that it allows us to use these sinks to create pairwise distance/similarity measure between the ith and jth unit. In this instance, the units in this directed acyclic network are the ith and jth decisions of the United States Supreme Court.
Now, it is important to note cases contain many citations and thus can be oriented relative to many different sinks. So, even if a case can be traced to the Marbury sink – this does not preclude it from being traced to other sinks as well. Also, it is possible to design many mathematical functions to characterize the sink based distance between units. For instance, the importance of a sink might decay as its shortest path length increases. An alternative measure might weight the importance of each sinks by the number of unique ancestors shared between nodes i and j that are descended from a given sink of interest. Indeed, many fine-grained choices are possible but they require justification drawn from the given substantive problem …
The Development of Structure in the Citation Network of the United States Supreme Court
The Development of Structure in the Citation Network of the United States Supreme Court — Now in HD! from Computational Legal Studies on Vimeo.
What are some of the key takeaway points?
(1) The Supreme Court’s increasing reliance upon its own decisions over the 1800-1830 window.
(2) The important role of maritime/admiralty law in the early years of the Supreme Court’s citation network. At least with respect to the Supreme Court’s citation network, these maritime decisions are the root of the Supreme Court’s jurisprudence.
(3) The increasing centrality of decisions such as Marbury v. Madison, Martin v. Hunter’s Lessee to the overall network.
The Development of Structure in the SCOTUS Citation Network
The visualization offered above is the largest weakly connected component of the citation network of the United States Supreme Court (1800-1829). Each time slice visualizes the aggregate network as of the year in question.
In our paper entitled Distance Measures for Dynamic Citation Networks, we offer some thoughts on the early SCOTUS citation network. In reviewing the visual above note ….“[T]he Court’s early citation practices indicate a general absence of references to its own prior decisions. While the court did invoke well-established legal concepts, those concepts were often originally developed in alternative domains or jurisdictions. At some level, the lack of self-reference and corresponding reliance upon external sources is not terribly surprising. Namely, there often did not exist a set of established Supreme Court precedents for the class of disputes which reached the high court. Thus, it was necessary for the jurisprudence of the United States Supreme Court, seen through the prism of its case-to-case citation network, to transition through a loading phase. During this loading phase, the largest weakly connected component of the graph generally lacked any meaningful clustering. However, this sparsely connected graph would soon give way, and by the early 1820’s, the largest weakly connected component displayed detectable structure.”
What are the elements of the network?
What are the labels?
To help orient the end-user, the visualization highlights several important decisions of the United States Supreme Court offered within the relevant time period:
Marbury v. Madison, 5 U.S. 137 (1803) we labeled as “Marbury”
Murray v. The Charming Betsey, 6 U.S. 64 (1804) we labeled as “Charming Betsey”
Martin v. Hunter’s Lessee, 14 U.S. 304 (1816) we labeled as “Martin’s Lessee”
The Anna Maria, 15 U.S. 327 (1817) we labeled as “Anna Maria”
McCulloch v. Maryland, 17 U.S. 316 (1819) we labeled as “McCulloch”
Why do cases not always enter the visualization when they are decided?
As we are interested in the core set of cases, we are only visualizing the largest weakly connected component of the United States Supreme Court citation network. Cases are not added until they are linked to the LWCC. For example, Marbury v. Madison is not added to the visualization until a few years after it is decided.
How do I best view the visualization?
Those interested in viewing the full screen video—click on the full screen icon contained in the Vimeo bottom banner. Check out the NEW Hi-Def (HD) version of the video!
