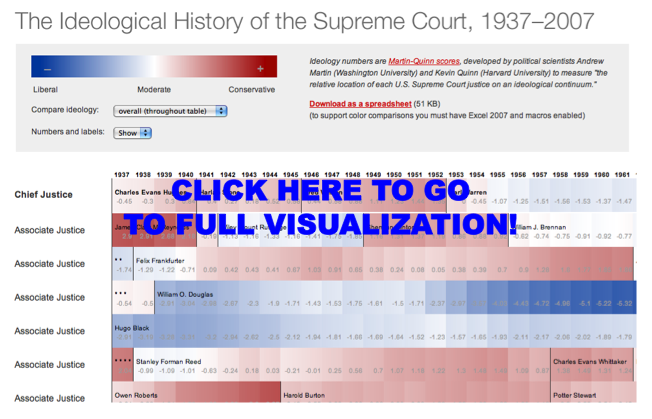
Here is a cool visual for the Martin-Quinn Scores. For those of you not familiar, the Martin-Quinn paper and “MQ Scores” represented a significant breakthrough in the field of judicial politics. On that note, Stephen Jessee & Alexander Tahk have done a nice job both bringing their data up to date and extending their work. For those interested, click on the visual above and check out all of the relevant links contained within this post.
Tag: evolution of law
Taking Judicial Content Seriously–Lupu & Fowler’s Strategic Content Model
In my conversations with judicial politics scholars, many lament how many of our existing approaches tend to ignore opinion content. For those interested in embedding opinion content into existing theories of judicial decision making … consider Yonatan Lupu & James Fowler’s paper recently posted to the SSRN.
The authors present a strategic model of judicial bargaining over opinion content. They note … “we find that the Court generates opinions that are better grounded in law when more justices write concurring opinions.” To generate the specification for “grounding in law” the authors use Kleinberg’s Hubs and Authorities Algorithm calculated at the time the opinion was authored. The Strategic Content Paper is available here.
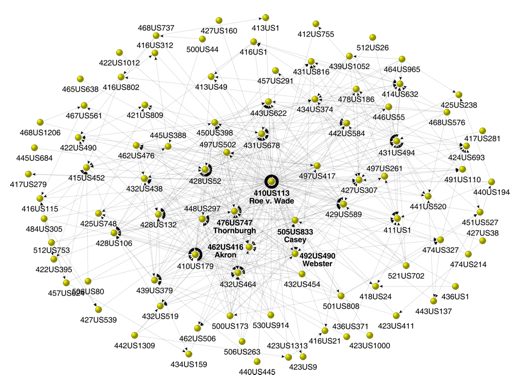
The visual above is drawn from a related Fowler project located here. Another very worthwhile paper authored by Fowler, Johnson, Spriggs, Jeon & Wahlbeck is located here.
The Revolution Will Not Be Televised — But Will it Come from HLS or YLS ? A Social Network Analysis of the Legal Academy (Part IV)
This is the final installment of posts related to Reproduction of Hierarchy? A Social Network Analysis of the American Law Professoriate. Thanks for your emails.
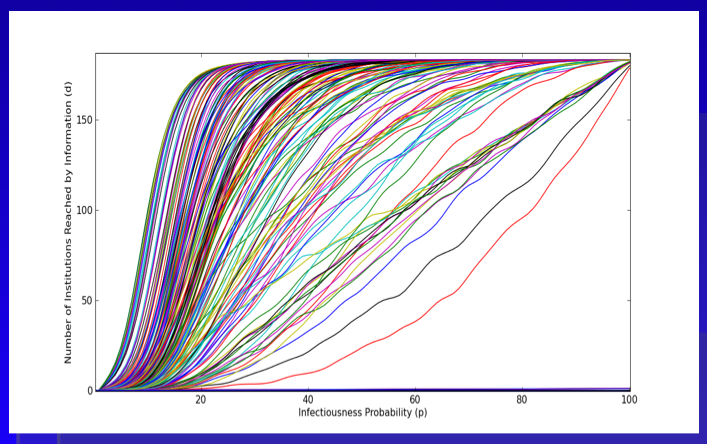
Here is the plot we provide within the paper. As a general proposition, we believe this represents an upper bound measure for the intellectual reach of an agenda offered by a given institution. With respect to our version of the Reed Frost Epidemiological Model, we use the p parameter to model “idea infectiousness.” When p = 1 every institution “contacted” by the idea is infected with the idea. When p = 0 no institution “contacted” by the idea is infected. In this version, we use the programming language python to run the model 500 times per institution. The above plot represents an estimate of the “diffusion curve” for each of the 184 institutions in our model. Building off central limit type properties, this leaves a far better estimate of reach than is offered in the single model run from the previous Netlogo GUI.
A cursory review of the above plot demonstrates, we are far from the land of linearity. Namely, a large number of institutions are able to reach much of the graph with very small changes in the value of p.
In the Structure of Scientific Revolutions, Kuhn quotes from Max Planck: “a new scientific truth does not triumph by convincing its opponents and making them see the light, but rather because its opponents eventually die, and a new generation grows up that is familiar with it.” Following Planck, we believe retirement is indeed be an important mechanism. However, we also argue the nature of the p parameter is a relevant consideration. In fact, unpacking various dimensions of p is the key to the broader model. Specifically, what are the properties of an idea that generate its infectiousness? Of course, we might like to believe infectiousness is related to a class of normatively attractive properties such as promoting efficiency or justice. However, it is not clear that this follows.
We took no pass on the question of whether some institutions would be better or worse at producing ideas with greater or lesser values of p. The motivated question for this post considers whether, in general, the institutions which are top producers of law professors are (1) leaders in innovation, (2) subsequent ratifiers of a newly established paradigm or (3) defenders of the status quo. In a deep sense, we are asking how to reasonably model decision making by the heterogeneous agents located at such institutions. Do institutions reward or punish intellectual risk-taking, search, etc.?
While this is an empirical question beyond the scope of this post, it worth asking because it partially informs the micro-dynamics plausibly responsible for generating the spread of new intellectual paradigms.
Model of Intellectual Diffusion Upon the American Legal Academy
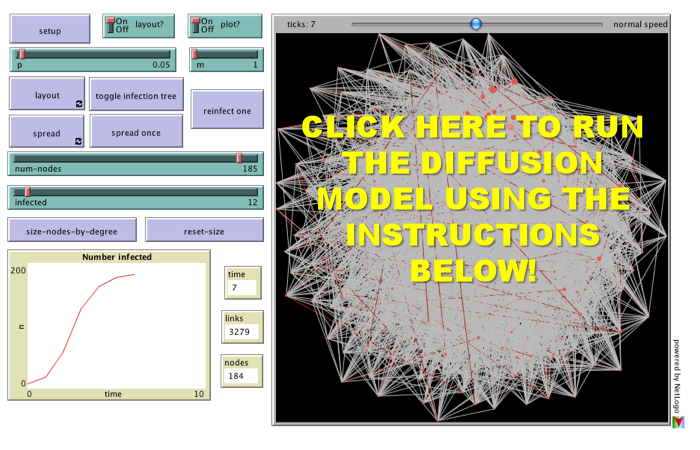 For the third installment of posts related to Reproduction of Hierarchy? A Social Network Analysis of the American Law Professoriate, we offer a Netlogo simulation of intellectual diffusion on the network we previously visualized. As noted in prior posts, we are interested legal socialization and its role in considering the spread of particular intellectual or doctrinal paradigms. This model captures a discrete run of the social epidemiological model we offer in the paper. As we noted within the paper, this represents a first cut on the question—where we favor parsimony over complexity. In the paper and in the model documentation, we offer some possible model extensions which could be considered in future scholarship.
Once you click through to the model, here is how it works:
(1) Click the Setup Button in the Upper Left Corner. This will Display the Network in the Circular Layout.
(2) Click the Layout Button. Depending upon the speed of your machine this may take up to 30 seconds. Stop the Layout Button by Re-Clicking the Button.
(3) Click the Size Nodes by Degree Button. You Will Notice the Fairly Central Node Colored in Red. This is School #12 Northwestern University Law School. Observe how we have set the default infected school as #12 Northwestern (Hat Tip to Uri Wilensky). A Full List of School Number is available at the bottom of the page when you click through.
(4) Now, we are ready to begin. Click the Spread Once Button. The idea then reaches its neighbors with probability p (set as a default at .05). You can click the Toggle Infection Tree button (at any point) to observe the discrete paths traversed by the idea.
(5) Click the Spread Once Button, again and again. Notice the plot tracking the time on the x axis and the number of institution infected on the y axis. This is an estimate of the diffusion curve for the institution.
(6) To restart the simulation, click the Reinfect One button. Prior to hitting this button, slide the Infected Slider to any Law School you would like to observe. Also, feel free to adjust the p slider to increase or decrease the infectiousness of the idea.
Please comment if you have any difficulty or questions. Note you must have Java 1.4.1 + installed on your computer. The Information Technology professionals at many institutions will have already installed this on your machine but if not you will need to download it. We hope you enjoy!
Tax Day! A First-Order History of the Supreme Court and Tax
Click to view the full image.
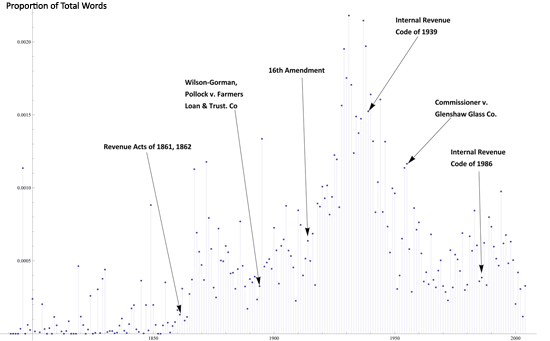
In honor of Tax Day, we’ve produced a simple time series representation of the Supreme Court and tax. The above plot shows the how often the word “tax” occurs in the cases of the Supreme Court, for each year – that is, what proportion of all words in every case in a given year are the word “tax.” The data underneath includes non-procedural cases from 1790 to 2004. The arrows highlight important legislation and cases for income tax as well.
Make sure to click through the image to view the full size.
Happy Tax Day!

