Blaise Aguera y Arcas Demos Augmented-Reality Maps [Ted 2010]

“Blaise Aguera y Arcas is an architect at Microsoft Live Labs, architect of Seadragon, and the co-creator of Photosynth, a monumental piece of software capable of assembling static photos into an interactive three-dimensional space. This seamless patchwork of images can be viewed via multiple angles and magnifications, allowing us to look around corners or “fly” in for a (much) closer look ….”

United States Court of Appeals & Parallel Tag Clouds from IBM Research [Repost from 10/23]

Download the paper: Collins, Christopher; Viégas, Fernanda B.; Wattenberg, Martin. Parallel Tag Clouds to Explore Faceted Text Corpora To appear in Proceedings of the IEEE Symposium on Visual Analytics Science and Technology (VAST), October, 2009. [Note: The Paper is 24.5 MB]

Here is the abstract: Do court cases differ from place to place? What kind of picture do we get by looking at a country’s collection of law cases? We introduce Parallel Tag Clouds: a new way to visualize differences amongst facets of very large metadata-rich text corpora. We have pointed Parallel Tag Clouds at a collection of over 600,000 US Circuit Court decisions spanning a period of 50 years and have discovered regional as well as linguistic differences between courts. The visualization technique combines graphical elements from parallel coordinates and traditional tag clouds to provide rich overviews of a document collection while acting as an entry point for exploration of individual texts. We augment basic parallel tag clouds with a details-in-context display and an option to visualize changes over a second facet of the data, such as time. We also address text mining challenges such as selecting the best words to visualize, and how to do so in reasonable time periods to maintain interactivity.

The Age of Quantum Computing? [From Nature]

From the Abstract … “The race is on to build a computer that exploits quantum mechanics. Such a machine could solve problems in physics, mathematics and cryptography that were once thought intractable, revolutionizing information technology and illuminating the foundations of physics. But when?” (Subscription may be required for Access)

Netflix Challenge for SCOTUS Prediction?

During our break from blogging, Ian Ayers offered a very interesting post over a Freakonomics entitled “Prediction Markets vs. Super Crunching: Which Can Better Predict How Justice Kennedy Will Vote?” In general terms, the post compares the well known statistical model offered by Martin-Quinn to the new Supreme Court Fantasy League created by Josh Blackman. We were particularly interested in a sentence located at end of the post … “[T]he fantasy league predictions would probably be more accurate if market participants had to actually put their money behind their predictions (as with intrade.com).”  This point is well taken. Extending the idea of having some “skin in the game,” we wondered what sort of intellectual returns could be generated for the field of quantitative Supreme Court prediction by some sort of Netflix style SCOTUS challenge.

The Martin-Quinn model has significantly advanced the field of quantitative analysis of the United States Supreme Court. However, despite all of the benefits the model has offered, it is unlikely to be the last word on the question. While only time will tell, an improved prediction algorithm might very well be generated through the application of ideas in machine learning and via incorporation of additional components such as text, citations, etc.

With significant financial sum at stake … even far less than the real Netflix challenge … it is certainly possible that a non-trivial mprovement could be generated. In a discussion among a few of us here at the Michigan CSCS lab, we generated the following non-exhaustive set of possible ground rules for a Netflix Style SCOTUS challenge:

  1. To be unseated, the winning team should be required to make a non-trivial improvement upon the out-of-sample historical success of the Martin-Quinn Model.
  2. To prevent overfitting, the authors of this non-trivial improvement should be required to best the existing model for some prospective period.
  3. All of those who submit agree to publish their code in a standard programming language (C, Java, Python, etc.) with reasonable commenting / documentation.

Broken Promises of Privacy: Responding to the Surprising Failure of Anonymization

Ohm on Privacy

On this blog, we have previously featured the work of Paul Ohm (Colorado Law School) including his important article Computer Programming and the Law: A New Research Agenda. Professor Ohm has recently posted Broken Promises of Privacy: Responding to the Surprising Failure of Anonymization, 57 UCLA Law Review ____ (forthcoming 2010). A review of SSRN downloads indicates that despite having been posted in just the last two months, this paper is the top downloaded new law paper posted to the SSRN in the past 12 months.

From the abstract: “Computer scientists have recently undermined our faith in the privacy-protecting power of anonymization, the name for techniques for protecting the privacy of individuals in large databases by deleting information like names and social security numbers. These scientists have demonstrated they can often “reidentify” or “deanonymize” individuals hidden in anonymized data with astonishing ease. By understanding this research, we will realize we have made a mistake, labored beneath a fundamental misunderstanding, which has assured us much less privacy than we have assumed. This mistake pervades nearly every information privacy law, regulation, and debate, yet regulators and legal scholars have paid it scant attention. We must respond to the surprising failure of anonymization, and this Article provides the tools to do so.”

The Structure of the United States Code

United States Code (All Titles)

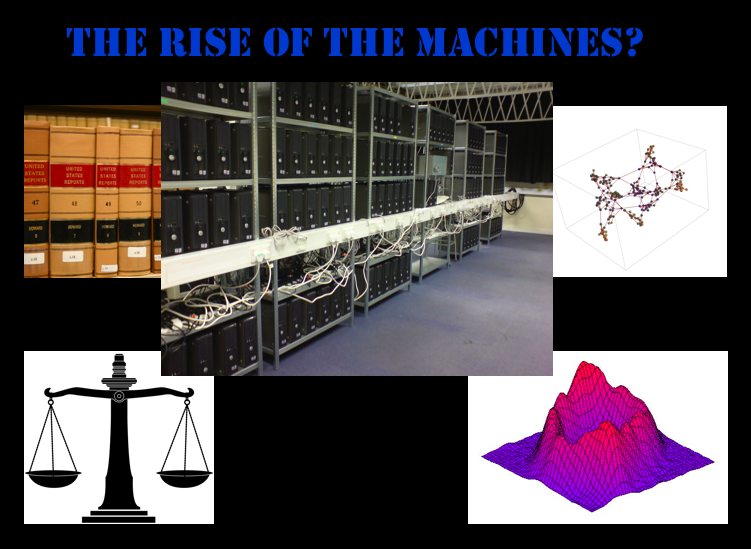
Formally organized into 50 titles, the United States Code is the repository for federal statutory law. While each of the 50 titles define a particular substantive domain, the structure within and across titles can be represent as a graph/network. In a series of prior posts, we offered visualizations at various “depths” for a number of well know U.S.C. titles. Click here and click Here for our two separate visualizations of the Tax Code (Title 26).  Click here for our visualization of the Bankruptcy Code (Title 11).  Click here for our visualization of Copyright (Title 17). While our prior efforts were devoted to displaying the structure of a given title of the US Code, the visualization above offers a complete view of the structure of the entire United States Code (Titles 1-50).

Using Seadragon from Microsoft Labs, each title is labeled with its respective number. The small black dots are “vertices” representing all sections in the aggregate US Code (~37,500 total sections). Given the size of the total undertaking, in the visual above, every title is represented to the “section level.”  As we described in earlier posts, a “section level” representation halts at the section and thus does not represent any of subsection depth.  For example, all sections under 26 U.S.C. § 501 including the well known § 501 (c) (3) are reattributed upward to their parent section.

There are two sources of structure within the United States Code. The explicitly defined structure / linkage / dependancy derives from the sections contained under a given title. The more nuanced version of structure is obtained from references or definitions contained within particular sections. This class of connections not only link sections within a given title but also connection sections across titles.  Within this above visual, we represent these important cross-title references by coloring them red.

Taken together, this full graph of the Untied States Code is quite large {i.e. directed graph (|V| = 37500, |E| = 197749)}. There exist 37,500 total sections distributed across the 50 Titles. However, these sections are not distributed in a uniform manner. For example, components such as Title 1 feature very few sections while Titles such as 26 and 42 contain many sections. The number of edges far outstrips the number of vertices with a total 197,000+ edges in the graph.

Picture 1 
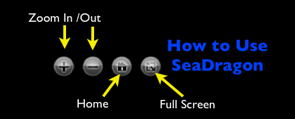
Seadragon has a number of nice features which enhance the experience of the end user. For example, a user can drag the image around by clicking and holding down the mouse button. Most importantly, is the symbol to the left. If you run your mouse over the above zoomable visual… look for this symbol to appear in the southeast corner.  Click on it and it will make the visual full size… as you will see… the full size visual makes for a far more compelling HCI