From the abstract: “There is a long standing debate over how to objectively compare the career achievements of professional athletes from different historical eras. Developing an objective approach will be of particular importance over the next decade as Major League Baseball (MLB) players from the “steroids era” become eligible for Hall of Fame induction. Here we address this issue, as well as the general problem of comparing statistics from distinct eras, by detrending the seasonal statistics of professional baseball players. We detrend player statistics by normalizing achievements to seasonal averages, which accounts for changes in relative player ability resulting from both exogenous and endogenous factors, such as talent dilution from expansion, equipment and training improvements, as well as performance enhancing drugs (PED). In this paper we compare the probability density function (pdf) of detrended career statistics to the pdf of raw career statistics for five statistical categories — hits (H), home runs (HR), runs batted in (RBI), wins (W) and strikeouts (K) — over the 90-year period 1920-2009. We find that the functional form of these pdfs are stationary under detrending. This stationarity implies that the statistical regularity observed in the right-skewed distributions for longevity and success in professional baseball arises from both the wide range of intrinsic talent among athletes and the underlying nature of competition. Using this simple detrending technique, we examine the top 50 all-time careers for H, HR, RBI, W and K. We fit the pdfs for career success by the Gamma distribution in order to calculate objective benchmarks based on extreme statistics which can be used for the identification of extraordinary careers.”
Happy Birthday to Computational Legal Studies
On March 17, 2009 we offered our first post here at the Computational Legal Studies Blog. It has been an exciting and fun year. Here are some of the highlights!
New Paper Available on SSRN: A Profitable Trading and Risk Management Strategy Despite Transaction Cost
Readers might be interested in an article that A. Duran and I have coming out in Quantitative Finance this year entitled A Profitable Trading and Risk Management Strategy Despite Transaction Cost. In the article, we develop a strategy which outperforms the “market” in rigorous out-of-sample testing. We’ve made sure to check the robustness of the results by performing Monte Carlo simulations on both the S&P 500 and Russell 2000 while varying the subsets of stocks and time periods used in the simulation.
The strategy is interesting in that it is based on behavioral patterns. Unlike many other algorithmic trading models, our strategy is modeled after a human trader with quarterly memory who categorizes the market return distribution and market risk into low, medium, and high categories. Technically, it accomplishes this by non-parametrically categorizing windowed estimates of the first four moments of the return distribution and the normalized leading eigenvalue of the windowed correlation matrix. Based on the assessment of these low/medium/high categories and past experience in similar states, the strategy then decides whether to invest in the market index, invest in the risk-free asset, or short the market. The strategy soundly outperforms the market index in multiple markets over random windows and on random subsets of stocks.
While you’re waiting for its publication in Quantitative Finance, you might check out a copy over at SSRN. Here’s the abstract and a figure below comparing the log-return of our strategy with the market over one realization:
We present a new profitable trading and risk management strategy with transaction cost for an adaptive equally weighted portfolio. Moreover, we implement a rule-based expert system for the daily financial decision making process by using the power of spectral analysis. We use several key components such as principal component analysis, partitioning, memory in stock markets, percentile for relative standing, the first four normalized central moments, learning algorithm, switching among several investments positions consisting of short stock market, long stock market and money market with real risk-free rates. We find that it is possible to beat the proxy for equity market without short selling for S&P 500-listed 168 stocks during the 1998-2008 period and Russell 2000-listed 213 stocks during the 1995-2007 period. Our Monte Carlo simulation over both the various set of stocks and the interval of time confirms our findings.
160,000 Hours of C-Span Coverage at Your Finger Tips
As reported in the NY Times … roughly 160,000 hours of C-SPAN coverage is going live for your consumption. Yet another example that the Era of Big Data is upon us!
The Dissemination of Culture — Axelrod (1997) Model — Now Available on Netlogo’s Community Models Page
Robert Axelrod’s 1997 Culture Model is a complex systems classic. Several versions of the model are available including one in Repast J. Perhaps the most user friendly version has recently been posted to Netlogo’s “community models” page. Those interested in experimenting with this Netlogo version of the model can click on the image above (provided you have Java 4.1 or higher installed).
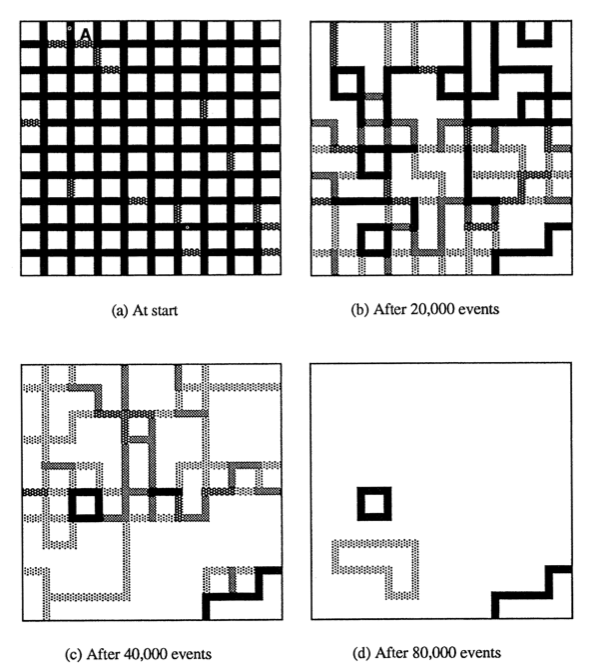
For those not previously familiar with the model … Figure 1 from the article is featured to the left and demonstrates a model run through 80,000 events. Those results are generated in the following manner:
“Patches are assigned a list of num-features integers which can each take on one of num-traits values. Each tag is called a feature, while it’s value is called the trait. The links in the view represent walls between patches where solid black walls mean there is no cultural similarity, and white walls mean the neighbors have the same culture.
The order of actions is as follows:
1) At random, pick a site to be active, and pick one of it’s neighbors
2) With probability equal to their cultural similarity, these sites interact. The active site replaces one of the features on which they differ (if any) with the corresponding trait of the neighbor.”
Those looking for the original article … here is the both the citation and a link: Robert Axelrod, The Dissemination of Culture: A Model with Local Convergence and Global Polarization, J. Conflict Res, 41, 203 (1997).
In the years following its release, several important extensions or applications have been offered. These include contributions from scholars in a wide number of disciplines including applied math, political science, economics and physics. Indeed, while many more articles are available in outlets such as the arXiv … here is a subset for your consideration ….
Damon Centola, Juan Carlos González-Avella, Víctor M. Eguíluz & Maxi San Miguel, Homophily, Cultural Drift and the Co-Evolution of Cultural Groups, J. Conflict Res. 51, 905 (2007).
Konstantin Klemm, Victor M. Eguíluz, Raul Toral, Maxi San Miguel, Globalization, Polarization and Cultural Drift, J. Economic Dynamics & Control 29, 321 (2005).
Konstantin Klemm, Victor M. Eguíluz, Raul Toral & Maxi San Miguel, Role of Dimensionality in Axelrod’s Model for the Dissemination of Culture, Physica A 327, 1 (2003).
Gregory Todd Jones — Evolution of Complexity and “Rethinking Individuality” at TedX Atlanta
As a member of the Society for Evolutionary Analysis in Law (SEAL), I have had the oppurtunity to see a number of interesting presentations by Gregory Todd Jones. Gregory is a Faculty Research Fellow and Adjunct Professor of Law at the Georgia State University College of Law as well as Senior Director of Research and Principal Scientist at the Network for Collaborative Problem Solving. Of particular interest to readers of this blog, he is also the founding director of the Computational Laboratory for Complex Adaptive Systems at Georgia State Law School.
Above is a recent talk by Gregory at the TedX Atlanta in which he (1) assembles a model of sustainability based on collaboration and (2) discusses species behavior … from slugs to chimpanzees. If you are interested in learning more … Gregory has launched a really cool blog … Cooperation Science Blog … Check it out!
Is It Real, or Is It Randomized?: A Financial Turing Test
 From the abstract … “We construct a financial “Turing test” to determine whether human subjects can differentiate between actual vs. randomized financial returns. The experiment consists of an online video-game where players are challenged to distinguish actual financial market returns from random temporal permutations of those returns. We find overwhelming statistical evidence (p-values no greater than 0.5%) that subjects can consistently distinguish between the two types of time series, thereby refuting the widespread belief that financial markets “look random.” A key feature of the experiment is that subjects are given immediate feedback regarding the validity of their choices, allowing them to learn and adapt. We suggest that such novel interfaces can harness human capabilities to process and extract information from financial data in ways that computers cannot.”
Down to the Wire … The Hurt Locker to Win the Oscar? [Intrade Prediction Market]
It is the final hours over at the Intrade’s Oscar Prediction Market. While many of the categories are runaways, the race for Best Picture is tightening. Will Avatar (click here for chart) or The Hurt Locker (click here or above for chart) prevail? Watch tonight to find out ….
On the Stability of Community Detection Algorithms on Longitudinal Citation Data: Paper & New Code
Last summer, Dan, Jon and I wrote our conference paper for ASNA 2009 entitled On the Stability of Community Detection Algorithms on Longitudinal Citation Data. The purpose of this paper was to experimentally explore a number of properties of community detection algorithms, especially as applied to citation networks (c.f. Supreme Court, Tax Court, United States Code).
The model is a fairly simple discrete-time directed growing graph. At time 0, we create a completely disconnected graph with some initial number of vertices. The number of new vertices after time 0 is then modeled by a homogeneous Poisson process. For each of these new vertices, we also model the number of edges per vertex as IID Poisson distributions. The probability distribution over these edges is specified by a modified preferential attachment mechanism.
Most of our questions consider what we’ve called the average pairwise stability. This can be thought of as answering the following question: “what is the probability that Alice and Bob are friends tomorrow if they were friends today?” Here, friendship corresponds to sharing the same community. By asking this question for all pairs of vertices (dyads) for all time steps in which both vertices existed, we get a probability that a community dyad is preserved from step to step. It is important to note that we’re not claiming all algorithms applied to all systems should have high average pairwise stability. In fact, for systems that involve dynamics like random rewiring, the only way to get high pairwise stability is to put all vertices in the same community or their own community at all steps – obviously trivial and unhelpful solutions in practice.
Given this model and this conception of stability, we want to perform the following experiments:
- How do the edge-betweenness, fast greedy, and leading eigenvector community detection algorithms compare in terms of their average pairwise stability…
- for varying levels of preferential attachment?
- for varying vertex and edge rates?
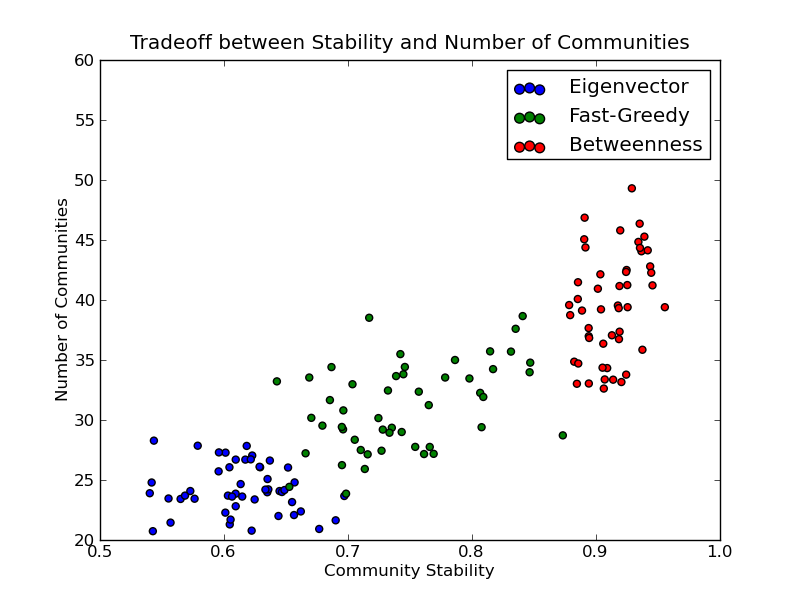
- Is there a significant tradeoff between the number of communities and the average pairwise stability of these community detection algorithms?
The answers are yes, yes, and yes! You should read the paper for more details.
I’ve also produced some code to help you assess the average pairwise stability for your dataset. The code requires igraph and is only in Python at this point due to an issue with R’s vertex label handling (which I can hopefully work around). You can get the average pairwise stability methods on github and check out the example below:
Gary Flake: Is Pivot a Turning Point for Web Exploration? [TED 2010]
Another in the series of talks at TED 2010 …. From the description … “Gary Flake demos Pivot, a new way to browse and arrange massive amounts of images and data online. Built on breakthrough Seadragon technology, it enables spectacular zooms in and out of web databases, and the discovery of patterns and links invisible in standard web browsing.”
The Data Deluge [Via The Economist]
The cover story of this week’s Economist is entitled The Data Deluge. This is, of course, a favorite topic of the hosts of this blog. While a number of folks have already highlighted this trend, we are happy to see a mainstream outlet such the Economist reporting on the era of big data. Indeed, the convergence of rapidly increasing computing power, and decreasing data storage costs, on one side, and large scale data collection and digitization on the other … has already impacted practices in the business, government and scientific communities. There is ample reason to believe that more is on the way.
In our estimation, for the particular class of questions for which data is available, two major implications of the deluge are worth reiterating: (1) no need to make assumptions about the asymptotic performance of a particular sampling frames when population level data is readily available; and (2) what statistical sampling was to the 20th century, data filtering may very well be to the 21st ….


