From the abstract… “The mechanisms driving the nucleation, spread, and dissipation of crime hotspots are poorly understood. As a consequence, the ability of law enforcement agencies to use mapped crime patterns to design crime prevention strategies is severely hampered. We also lack robust expectations about how different policing interventions should impact crime. Here we present a mathematical framework based on reaction-diffusion partial differential equations for studying the dynamics of crime hotspots. The system of equations is based on empirical evidence for how offenders move and mix with potential victims or targets. Analysis shows that crime hotspots form when the enhanced risk of repeat crimes diffuses locally, but not so far as to bind distant crime together. Crime hotspots may form as either supercritical or subcritical bifurcations, the latter the result of large spikes in crime that override linearly stable, uniform crime distributions. Our mathematical methods show that subcritical crime hotspots may be permanently eradicated with police suppression, whereas supercritical hotspots are displaced following a characteristic spatial pattern. Our results thus provide a mechanistic explanation for recent failures to observe crime displacement in experimental field tests of hotspot policing.”
From the abstract … “The authors review research on judgments of random and nonrandom sequences involving binary events with a focus on studies documenting gambler’s fallacy and hot hand beliefs. The domains of judgment include random devices, births, lotteries, sports performances, stock prices, and others. After discussing existing theories of sequence judgments, the authors conclude that in many everyday settings people have naive complex models of the mechanisms they believe generate observed events, and they rely on these models for explanations, predictions, and other inferences about event sequences. The authors next introduce an explanation-based, mental models framework for describing people’s beliefs about binary sequences, based on 4 perceived characteristics of the sequence generator: randomness, intentionality, control, and goal complexity. Furthermore, they propose a Markov process framework as a useful theoretical notation for the description of mental models and for the analysis of actual event sequences.”
“Blaise Aguera y Arcas is an architect at Microsoft Live Labs, architect of Seadragon, and the co-creator of Photosynth, a monumental piece of software capable of assembling static photos into an interactive three-dimensional space. This seamless patchwork of images can be viewed via multiple angles and magnifications, allowing us to look around corners or “fly” in for a (much) closer look ….”
This is a very important paper by Jonathan Chang and David Blei. Suffice to say, it has potential use in a wide class of social science applications. Click here to access related material on Professor Blei’s Princeton homepage. Click here for some slides (note 7.0 mb). Check it out!
It is important to note the above data is merely the raw data. While we obviously could threshold for number of graduates per school, we choose not to do so because we do not have any particular theoretic reason to believe that placements linearly scale to differences in size of graduating classes. In other words, given we do not know the proper functional form — we just offer the raw data. For those interested in other posts on this subject, please click on thelaw clerks tag. or the law schools tag.
“Statistical Visual thinking will one day be as necessary for efficient citizenship as the ability to read and write.” {Revised Version of H.G. Wells Quote }
(1) The Supreme Court’s increasing reliance upon its own decisions over the 1800-1830 window.
(2) The important role of maritime/admiralty law in the early years of the Supreme Court’s citation network. At least with respect to the Supreme Court’s citation network, these maritime decisions are the root of the Supreme Court’s jurisprudence.
The Development of Structure in the SCOTUS Citation Network
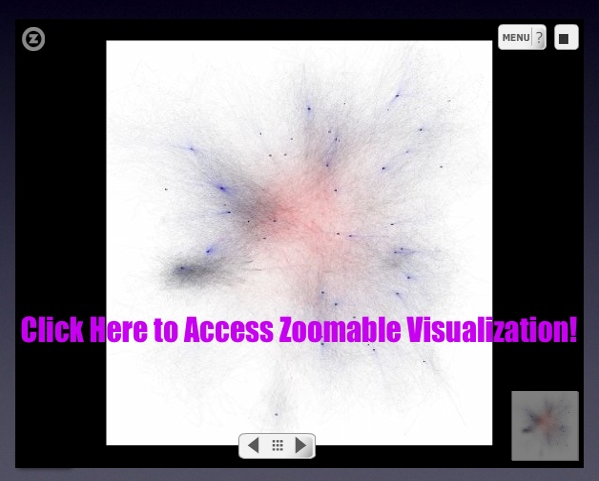
The visualization offered above is the largest weakly connected component of the citation network of the United States Supreme Court (1800-1829). Each time slice visualizes the aggregate network as of the year in question.
In our paper entitled Distance Measures for Dynamic Citation Networks, we offer some thoughts on the early SCOTUS citation network. In reviewing the visual above note ….“[T]he Court’s early citation practices indicate a general absence of references to its own prior decisions. While the court did invoke well-established legal concepts, those concepts were often originally developed in alternative domains or jurisdictions. At some level, the lack of self-reference and corresponding reliance upon external sources is not terribly surprising. Namely, there often did not exist a set of established Supreme Court precedents for the class of disputes which reached the high court. Thus, it was necessary for the jurisprudence of the United States Supreme Court, seen through the prism of its case-to-case citation network, to transition through a loading phase. During this loading phase, the largest weakly connected component of the graph generally lacked any meaningful clustering. However, this sparsely connected graph would soon give way, and by the early 1820’s, the largest weakly connected component displayed detectable structure.”
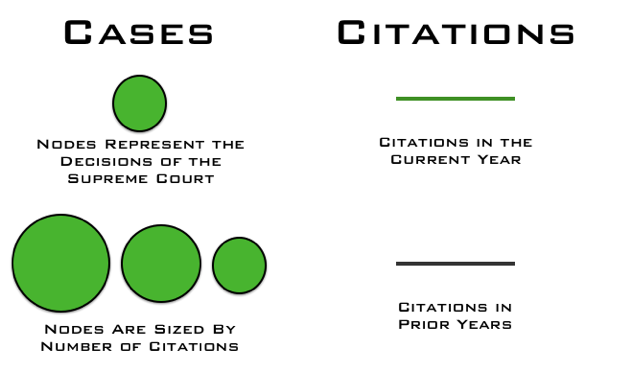
What are the elements of the network?
What are the labels?
To help orient the end-user, the visualization highlights several important decisions of the United States Supreme Court offered within the relevant time period:
Why do cases not always enter the visualization when they are decided?
As we are interested in the core set of cases, we are only visualizing the largest weakly connected componentof the United States Supreme Court citation network. Cases are not added until they are linked to the LWCC. For example, Marbury v. Madison is not added to the visualization until a few years after it is decided.
How do I best view the visualization?
Given this is a high-definition video, it may take few seconds to load. We believe that it is worth the wait. In our view, the video is best consumed (1) Full Screen (2) HD On (3) Scaling Off.
Where can I find related papers?
Here is a non-exhaustive list of related scholarship:
(1) The Supreme Court’s increasing reliance upon its own decisions over the 1800-1830 window.
(2) The important role of maritime/admiralty law in the early years of the Supreme Court’s citation network. At least with respect to the Supreme Court’s citation network, these maritime decisions are the root of the Supreme Court’s jurisprudence.
The Development of Structure in the SCOTUS Citation Network
The visualization offered above is the largest weakly connected component of the citation network of the United States Supreme Court (1800-1829). Each time slice visualizes the aggregate network as of the year in question.
In our paper entitled Distance Measures for Dynamic Citation Networks, we offer some thoughts on the early SCOTUS citation network. In reviewing the visual above note ….“[T]he Court’s early citation practices indicate a general absence of references to its own prior decisions. While the court did invoke well-established legal concepts, those concepts were often originally developed in alternative domains or jurisdictions. At some level, the lack of self-reference and corresponding reliance upon external sources is not terribly surprising. Namely, there often did not exist a set of established Supreme Court precedents for the class of disputes which reached the high court. Thus, it was necessary for the jurisprudence of the United States Supreme Court, seen through the prism of its case-to-case citation network, to transition through a loading phase. During this loading phase, the largest weakly connected component of the graph generally lacked any meaningful clustering. However, this sparsely connected graph would soon give way, and by the early 1820’s, the largest weakly connected component displayed detectable structure.”
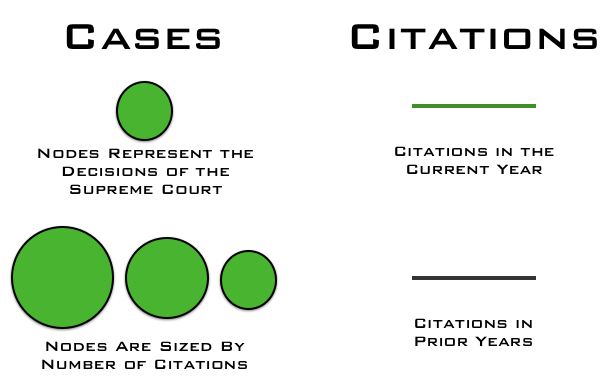
What are the elements of the network?
What are the labels?
To help orient the end-user, the visualization highlights several important decisions of the United States Supreme Court offered within the relevant time period:
Why do cases not always enter the visualization when they are decided?
As we are interested in the core set of cases, we are only visualizing the largest weakly connected componentof the United States Supreme Court citation network. Cases are not added until they are linked to the LWCC. For example, Marbury v. Madison is not added to the visualization until a few years after it is decided.
How do I best view the visualization?
Those interested in viewing the full screen video—click on the full screen icon contained in the Vimeo bottom banner. Check out the NEW Hi-Def (HD) version of the video!
Download the paper: Collins, Christopher; Viégas, Fernanda B.; Wattenberg, Martin. Parallel Tag Clouds to Explore Faceted Text CorporaTo appear in Proceedings of the IEEE Symposium on Visual Analytics Science and Technology (VAST), October, 2009. [Note: The Paper is 24.5 MB]
Here is the abstract: Do court cases differ from place to place? What kind of picture do we get by looking at a country’s collection of law cases? We introduce Parallel Tag Clouds: a new way to visualize differences amongst facets of very large metadata-rich text corpora. We have pointed Parallel Tag Clouds at a collection of over 600,000 US Circuit Court decisions spanning a period of 50 years and have discovered regional as well as linguistic differences between courts. The visualization technique combines graphical elements from parallel coordinates and traditional tag clouds to provide rich overviews of a document collection while acting as an entry point for exploration of individual texts. We augment basic parallel tag clouds with a details-in-context display and an option to visualize changes over a second facet of the data, such as time. We also address text mining challenges such as selecting the best words to visualize, and how to do so in reasonable time periods to maintain interactivity.
From the Abstract … “The race is on to build a computer that exploits quantum mechanics. Such a machine could solve problems in physics, mathematics and cryptography that were once thought intractable, revolutionizing information technology and illuminating the foundations of physics. But when?” (Subscription may be required for Access)
Mike and I have been working on a paper we hope to soon post to the SSRN entitled ” The Structure and Complexity of the United States Code.” Yesterday, we presented a pre-alpha version of the paper in the Michigan Center for Political Studies Workshop For those who might be interested, the abstract for the working abstract for the paper is below. If you are interested in accessing documentation for the above visualization please click here.
“The United States Code is the substantively important body of information that collectively constitutes the federal statutory law of the United States. The Code is a complied hierarchical document organized into fifty substantive titles including Bankruptcy (Title 11), Judiciary and Judicial Procedure (Title 28), Public Health, and Welfare (Title 42) and Tax (Title 26). In addition to its hierarchical organization, the Code contains an extensive citation network where cross-references connect its provisions in a variety of novel manners.
Claims regarding complexity of the Code, in particular the Internal Revenue Code, are consistently part of the public discourse. Undoubtedly, the Code is complicated. However, quantifying its complexity is a far more difficult proposition. While there have been some initial attempts to identify the size of certain pieces of the Code, few comprehensive or comparative investigations of the entire United States Code have been undertaken.
In this article, we ask how complex is the United States Code and in comparative terms which titles are the most and least complex? Employing a wide variety of approaches including techniques drawn from information theory, computer science, linguistics and applied graph theory, we develop and apply a series of distinct measures for the structural and linguistic complexity of the Code. After developing these discrete approaches, we generate a composite measure and use it to comparatively score each of the Code’s titles. While we recognize other composite measures for size and complexity could legitimately be offered, we believe our interdisciplinary approach represents a significant advance and provides much needed rigor to questions of code complexity.”
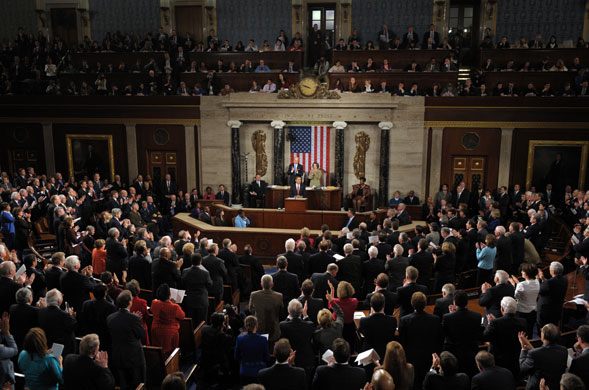
The State of the Union often provides for dramatic political theatre. While watching President Obama’s first State of the Union Addresslast night, I could not help but think about a particular subplot associated with the speech–the Republican caucus and the “standing ovation problem.” With respect to being the party not currently occupying the White House–from the individual member all the way up to the full caucus–it is difficult for the individual member to determine (1) whether to applaud (2) if a given statement by the President is worthy of a standing ovation. From my passive consumption of the television coverage, there was clearly significant variation in the number of Republican caucus members standing at any given applause moment.
For those not familiar, here is a State of the Union based description of the standing ovation problem. “The standing ovation model illustrates a familiar decision-making problem: after hearing a given statement by the President a subset of the audience begins to applaud. The applause builds and a few members of the respective caucus may decide to stand up in enthusiastic recognition. In this situation every other member of the respective caucus must decide whether to join the standing individuals in their ovation, or else remain seated. It is not a trivial decision; imagine, for example, that you initially decide to stay down quietly but then find yourself surrounded by people standing and clapping vigorously. It seems plausible that you may feel awkward, change your mind and end up standing up, saving yourself a significant dose of potential embarrassment. Analogously, you probably wouldn’t enjoy being the only person standing and clapping alone in the middle of a crowded chamber of seated people.”
While often considered along with other related information cascade problems, generating agent based models for the so called “standing ovation problem” has been the focus of a number of scholars. For example, along with John Miller (Carnegie Mellon), Michigan CSCS Director Scott E. Page has authored a leading article on the “standing ovation problem.” Using an agent based modeling approach, Miller & Page analyze a variety dynamics associated with this rich problem. For those interested, here is a link to a standing ovation ABM in Netlogo (requires Java).