DOCUMENTATION FOR THE VISUALIZATION
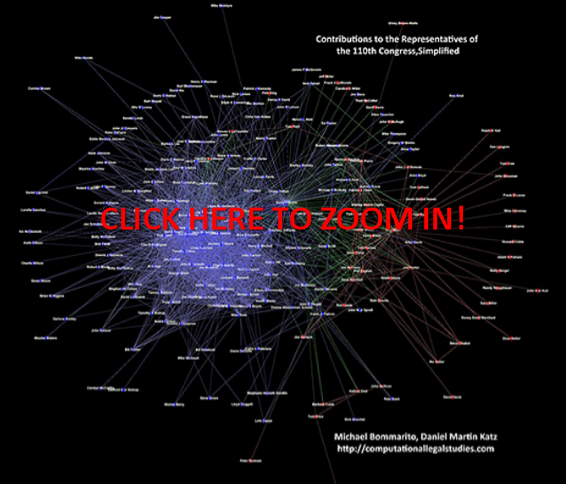
Visualizing the Campaign Contributions to the Representatives of the 110th Congress —
The House Edition
University of Michigan
Center for the Study of Complex Systems
Department of Political Science
BASIC OVERVIEW:
110th Congress = January 3, 2007 – January 3, 2009
435 Voting Members of the United States House of Representatives + District of Columbia (Eleanor Holmes Norton) + Puerto Rico (Luis Fortuno) + Virgin Islands (Donna Christian-Green) + American Samoa (Eni F H Faleomavega) + Guam (Madeleine Z Bordallo)
Click here and here for the Senators of the 110th Congress.
BASIC RULE:
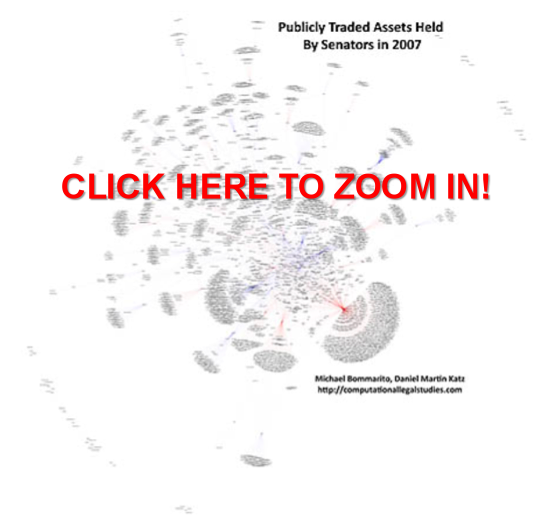
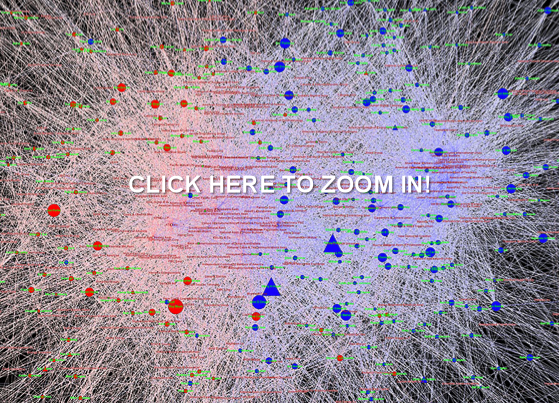
Squares (Institutions) Introduce Money into the System and Circles (Congressmen) Receive Money.
DATA OVERVIEW:
Using recently published data on campaign contributions collected by the Federal Election Commission and aggregated by the Center for Responsive Politics our visualizations track large money donations to members of the 110th Congress over the 2007 – 2008 window.
It is important to note that most of these organizations did not directly donate. Rather, as noted by the Center for Responsive Politics “the money came from the organization’s PAC, its individual members or employees or owners, and those individuals’ immediate families. Organization totals include subsidiaries and affiliates. Of course, it is impossible to know either the economic interest that made each individual contribution possible or the motivation for each individual giver. However, the patterns of contributions provide critical information for voters, researchers and others.”
The Center describes its methodology here http://www.opensecrets.org/politicians/method_pop.php.
To provide for an optically tractable view of the top contributions, we follow the CRP and impose the limiting requirement that to be included in our tally a given group’s contribution must fall within a given house members top contributor list.
We try to strike a tradeoff between information overload and incomplete disclosure.
In coming days, we will provide an additional visualization of the underlying data. Check back soon!
CONTRIBUTORS & CONTRIBUTIONS:
2,508 of the Donors are captured in the Graph.
Total Recorded Donations Introduced into our Visualization by these Entities Total to $113,134,698
(1) SIZING of the REPRESENTATIVE NODES — Each Circular node representing a Member of the House is sized according the amount of incoming donations. Thus, larger nodes are the recipients of larger sums of money while the smaller nodes received smaller amounts of money.

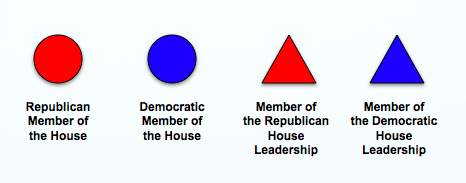
(2) COLORING and SHAPES of the REPRESENTATIVE NODES — Each node representing a Member of the United States House of Representatives is colored according their Political Party. Using popular convention, we color members of the Republican Party as Red and members of the Democratic Party as Blue.
(3) SIZING of the CONNECTIONS — Each Connection (Arc) between an Institution and a Member of the House is sized according to the amount of money flowing through a connection. Darker connections represent larger flows of money while lighter connections represent smaller amounts of money.

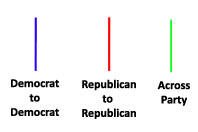
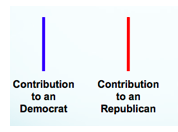
(4) COLORING of the CONNECTIONS — Each connection representing a campaign contribution from an entity to a member of Congress is colored according to partisan affiliation of the receiving representatives. Using popular convention, we color members of the Republican Party as Red and members of the Democratic Party as Blue.
(5) STRUCTURE OF THE GRAPH — The Graph is Visualized Using Fruchterman-Reingold. This is an automated spring embedded, force directed placement algorithm often used in the network science literature to visualize graphs of this size.
(6) ACKNOWLEDGEMENTS — We thank Rick Riolo, Jon Zelner, Carl Simon, Scott Page and the Center for Responsive Politics for their comments, contributions and/or data.
