Visualizing the Structure of H.R. 3962 — The Health Care Bill

HR 3962 Visual

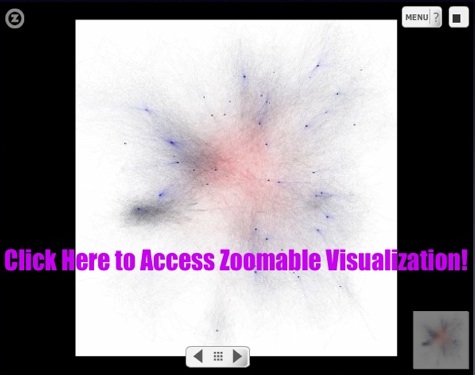
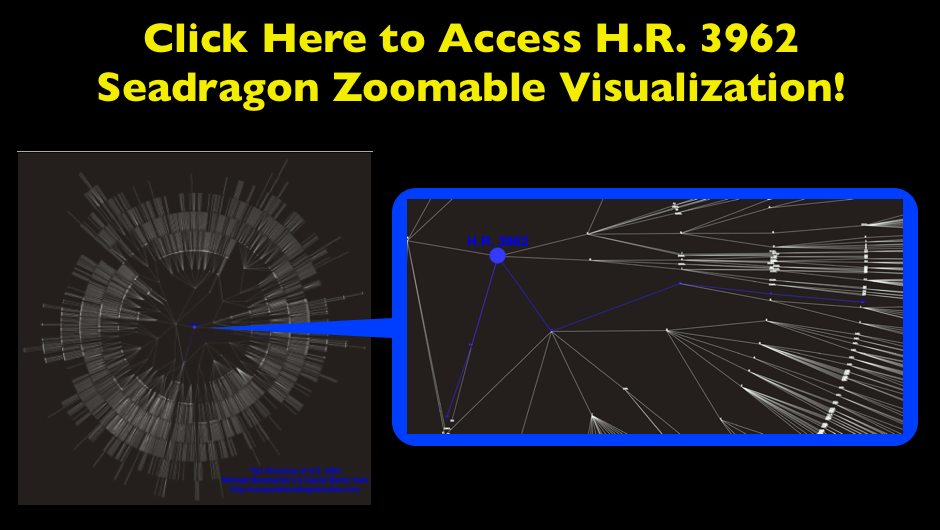
In addition to the facts we have presented on HR 3962, we wanted to offer a visualization for the structure of the Bill. Like many other bills, HR 3962, is divided into Divisions, Titles, Subtitles, Parts, Subparts, Sections, Subsections, Clauses, and Subclauses. These hierarchical splits represent the drafters’ conception of its organization, and thus the relative size of these categories may provide an indication of both the importance of each section of the Bill as well as the overall size of the document. By clicking through the image below, you can navigate a zoomable representation of the structure of HR 3962 using Microsoft’s Seadragon zoom interface.  Many of the Divisions, Titles, Subtitles, Parts, and Subparts of the Bill are labeled. The balance are not labeled because they fell on an angle on the radial layout which rendered them impossible to read.

The graph is laid out in a radial manner with the center node labeled “H.R. 3962.” Legislation, the broader United States Code as well as many other classes of information are organized as hierarchical documents. H.R. 3962 is no different. For those less familiar with this type of documents, we thought it useful to provide a tutorial regarding (1) how to use this zoomable visualization (2) the correspondence between the visual and the Library of Congress version of H.R. 3962


How Do I Open/Navigate the Visualization?

(1) Open the Library of Congress version of H.R. 3962 in another browser window.

(2) Open the visualization by clicking on the large image above.

(3) Clicking on the image above will take you to the Seadragon platform. (Note: Load times will vary from machine to machine… so please be patient.)

(4) Seadragon allows for zoomable visualizations and for full screen viewing. Full screen is really the best way to go. If you run your mouse over the black box where the visual is located you will see four buttons in the southeast corner.  The “full screen” button is the last one on the right. Click the button and you will be taken to full screen viewing!

(5) Click to zoom in and out, hold the mouse down and drag the entire visual, etc. Now, you are ready to traverse the graph using this visualization as your very own “H.R. 3962 Magic Decoder Wheel.”


How Do I Understand the Visualization?

To introduce the substance of the visualization, we have color coded two separate examples right into the visualization.

Example 1: Bills such as HR 3962 often feature a “short title” provision at the very begining of the legislation.  For example, if you download the PDF copy of the bill, you can see the short title at the bottom of page 1 of the bill.  You can also see this in the Library of Congress version of H.R. 3962.

SECTION 1. SHORT TITLE; TABLE OF DIVISIONS, TITLES, AND SUBTITLES.
(a) Short Title- This Act may be cited as the `Affordable Health Care for America Act’.

Zoom in close to start in the center where the large node labeled “HR 3962.”  Notice the blue colorized path features the blue labels 1. and terminates with the label (a). The labels in the graph are the labels in the text above.  While this is a simple example, the precise logic defines the entire graph.

Example 2: This is a bit more difficult as it requires the traversal of several provisions in order to reach a terminal node.  In this case, the terminal node read as follows … “SEC. 401. INDIVIDUAL RESPONSIBILITY.For an individual’s responsibility to obtain acceptable coverage, see section 59B of the Internal Revenue Code of 1986 (as added by section 501 of this Act).”

DIVISION A–AFFORDABLE HEALTH CARE CHOICES
TITLE IV–SHARED RESPONSIBILITY
Subtitle A–Individual Responsibility
SEC. 401. INDIVIDUAL RESPONSIBILITY.

Again, zoom in close to start in the center--where the large node labeled “HR 3962.”  Notice the blue colorized path features the blue labels A and terminates with the label 401. In between the start and finish, there are stops at IV and A, respectfully.  Just as before, the labels in the graph are the labels in the text above.  The end user can follow the precise journey but without the visual by using the Library of Congress version of H.R. 3962.

Facts About the Length of H.R. 3962, the Affordable Health Care for America Act (AHCAA)

In light of last night’s vote on H.R. 3962, the Affordable Health Care for America Act, we decided to calculate a few numbers on the current bill. Based on the Library of Congress’s XML representation of the bill (which can be obtained here), we have calculated a number of linguistic and citation properties of the Bill. The House of Representative approved HR 3962 by a 220-215 margin. The New York Times features a useful analysis of the vote including a breakout by party and region here.

On the Sunday morning talk shows as well as in other outlets, there has been significant discussion regarding the size of H.R. 3962. Specifically, many critics have decried the length of the bill citing its 1990 pages. The bill is indeed 1990 pages as you can see if you choose to download a PDF copy of the bill.

The purpose of this post is to provide a perspective regarding the length of H.R. 3962. Those versed in the typesetting practices of the United States Congress know that the printed version of a bill contains a significant amount of whitespace including non-trivial space between lines, large headers and margins, an embedded table of contents, and large font. For example, consider page 12 of the printed version of H.R. 3962.  This page contains fewer than 150 substantive words.

We believe a simple page count vastly overstates the actual length of bill. Rather than use page counts, we counted the number of words contained in the bill and compared these counts to the number of words in the existing United States Code. In addition, we consider the number of text blocks in the bill– where a text block is a unit of text under a section, subsection, clause, or sub-clause.


Basic Information about the Length of H.R. 3962

Number of words in H.R. 3962 impacting substantive law:

  • 234,812 words (w/ generous calculation)

Number of total words in H.R. 3962: 363,086 words (w/ titles, tables of contents …)
Number of text blocks: 7,961
Average number of words per text block: 24.18
Average words per section: 267.03


Is this a Large or Small Number? Comparison to Harry Potter

Number of substantive words in H.R. 3962: 234,812 words
Harry Potter and the Order of the Phoenix – 257,000 words
Harry Potter and the Goblet of Fire – 190,000 words
Harry Potter and the Deathly Hallows – 198,000 words


Is this a Large or Small Number? Comparison to Other Legislation

Number of substantive words in Energy Bill of 2007: 157,835 words
Number of substantive words in Defense Authorization Act for 2010: 119,960 Words
H.R. 3962 is roughly 2x the Size of Medicare Rx Bill of 2003 (Given there is no public XML version of the bill, the Exact “Substantive Words” Number is not available)


Is this a Large or Small Number? Comparison to the Full U.S. Code

Size of the United States Code: 42+ Million Words
Relative Size of H.R. 3962: H.R. 3962 is roughly 1/2 of one percent of the size of the United States Code


Longest Sections in H.R. 3962

  • Sec 341. Availability Through Health Insurance Exchange
  • Sec 1222. Demonstration to promote access for Medicare beneficiaries with limited English proficiency by providing reimbursement for culturally and linguistically appropriate services.
  • Sec 1160: Implementation, and Congressional review, of proposal to revise Medicare payments to promote high value health care
  • Sec 305: Funding for the construction, expansion, and modernization of small ambulatory care facilities
  • Sec 1417: Nationwide program for national and State background checks on direct patient access employees of long-term care facilities and providers


Modifications of the Existing U.S. Code By H.R. 3962

Number of Strikeouts: 332
Number of Inserts: 390
Number of Re-designations: 65


Acts Most Cited By H.R. 3962

Social Security Act: 622 times
Public Health Service Act: 134 times
Affordable Health Care for America Act: 60 times
Indian Health Care Improvement Act: 56 times
Indian Self-Determination and Education Assistance Act: 45 times
Employee Retirement Income Security Act: 39 times
Medicare Prescription Drug, Improvement, and Modernization Act: 11 times
American Recovery and Reinvestment Act: 7


Sections of the U.S. Code Cited (Properly) Most By H.R. 3962

25 U.S.C. §450. Congressional statement of findings: 38
25 U.S.C. §13. Expenditure of appropriations by Bureau: 13
42 U.S.C. §1396a(a). State plans for medical assistance: 10
42 U.S.C. §1396d(a). Definitions: 7
42 U.S.C. §2004a. Sanitation facilities: 7

Hustle and Flow: A Social Network Analysis of the American Federal Judiciary [Repost from 3/25]

Zoom on Network

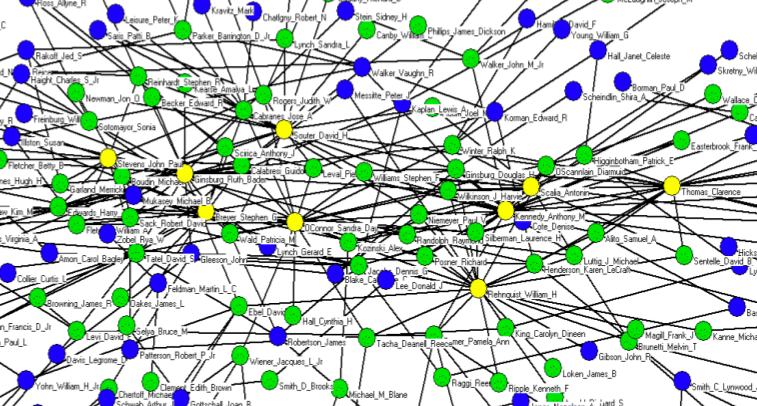
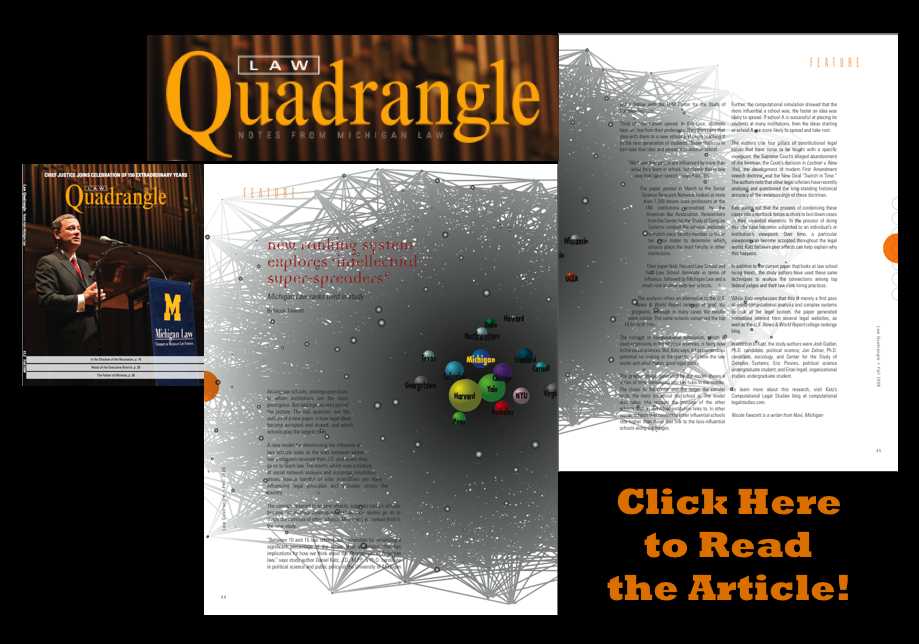
Together with Derek Stafford from the University of Michigan Department of Political Science, Hustle and Flow: A Social Network Analysis of the American Federal Judiciary represents our initial foray into Computational Legal Studies. The full paper contains a number of interesting visualizations where we draw various federal judges together on the basis of their shared law clerks (1995-2004). The screen print above is a zoom very center of the center of the network.  Yellow Nodes represent Supreme Court Justices, Green Nodes represent Circuit Court Justices, Blue Nodes represent District Court Justices.

There exist many high quality formal models of judicial decision making including those considering decisions rendered by judges in judicial hierarchy, whistle blowing, etc. One component which might meaningfully contribute to the extent literature is the rigorous consideration of the social and professional relationships between jurists and the impacts (if any) these relationships impose upon outcomes. Indeed, from a modeling standpoint, we believe the “judicial game” is a game on a graph–one where an individual strategic jurist must take stock of time evolving social topology upon which he or she is operating. Even among judges of equal institutional rank, we observe jurists with widely variant levels social authority (specifically social authority follows a power law distribution).

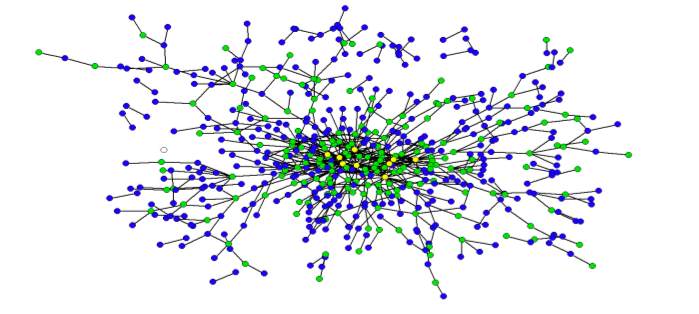
So what does all of this mean? Take whistle blowing — the power law distribution implies that if the average judge has a whistle, the “super-judges” we identify within the paper could be said to have an air horn. With the goal of enriching positive political theory / formal modeling of the courts, we believe the development of a positive theory of judicial social structure can enrich our understanding of the dynamics of prestige and influence. In addition, we believe, at least in part, “judicial peer effects” can help legal doctrine socially spread across the network. In that vein, here is a view of our operationalization of the social landscape … a wide shot of the broader network visualized using the Kamada-Kawai visualization algorithm:

Here is the current abstract for the paper: Scholars have long asserted that social structure is an important feature of a variety of societal institutions. As part of a larger effort to develop a fully integrated model of judicial decision making, we argue that social structure-operationalized as the professional and social connections between judicial actors-partially directs outcomes in the hierarchical federal judiciary. Since different social structures impose dissimilar consequences upon outputs, the precursor to evaluating the doctrinal consequences that a given social structure imposes is a descriptive effort to characterize its properties. Given the difficulty associated with obtaining appropriate data for federal judges, it is necessary to rely upon a proxy measure to paint a picture of the social landscape. In the aggregate, we believe the flow of law clerks reflects a reasonable proxy for social and professional linkages between jurists. Having collected available information for all federal judicial law clerks employed by an Article III judge during the “natural” Rehnquist Court (1995-2004), we use these roughly 19,000 clerk events to craft a series of network based visualizations.   Using network analysis, our visualizations and subsequent analytics provide insight into the path of peer effects in the federal judiciary. For example, we find the distribution of “degrees” is highly skewed implying the social structure is dictated by a small number of socially prominent actors. Using a variety of centrality measures, we identify these socially prominent jurists. Next, we draw from the extant complexity literature and offer a possible generative process responsible for producing such inequality in social authority. While the complete adjudication of a generative process is beyond the scope of this article, our results contribute to a growing literature documenting the highly-skewed distribution of authority across the common law and its constitutive institutions.

Broken Promises of Privacy: Responding to the Surprising Failure of Anonymization

Ohm on Privacy

On this blog, we have previously featured the work of Paul Ohm (Colorado Law School) including his important article Computer Programming and the Law: A New Research Agenda. Professor Ohm has recently posted Broken Promises of Privacy: Responding to the Surprising Failure of Anonymization, 57 UCLA Law Review ____ (forthcoming 2010). A review of SSRN downloads indicates that despite having been posted in just the last two months, this paper is the top downloaded new law paper posted to the SSRN in the past 12 months.

From the abstract: “Computer scientists have recently undermined our faith in the privacy-protecting power of anonymization, the name for techniques for protecting the privacy of individuals in large databases by deleting information like names and social security numbers. These scientists have demonstrated they can often “reidentify” or “deanonymize” individuals hidden in anonymized data with astonishing ease. By understanding this research, we will realize we have made a mistake, labored beneath a fundamental misunderstanding, which has assured us much less privacy than we have assumed. This mistake pervades nearly every information privacy law, regulation, and debate, yet regulators and legal scholars have paid it scant attention. We must respond to the surprising failure of anonymization, and this Article provides the tools to do so.”

Electricity Market Simulations @ Argonne National Labs

Electricity Market Simulations

Given my involvement with the Gerald R. Ford School of Public Policy, many have justifiably asked me to describe how a computational simulation could assist in the crafting of public policy. The Electricity Market Simulations run at Argonne National Lab represent a nice example. These are high level models run over six decision levels and include features such as a simulated bid market. Argonne has used this model to help the State of Illinois as well as several European countries regulate their markets for electricity.

The Structure of the United States Code [w/ Zoomorama] [Repost]

US CODE (All Titles)

Formally organized into 50 titles, the United States Code is the repository for federal statutory law. While each of the 50 titles define a particular substantive domain, the structure within and across titles can be represented as a graph/network. In a series of prior posts, we offered visualizations at various “depths” for a number of well know U.S.C. titles. Click here and click Here for our two separate visualizations of the Tax Code (Title 26).  Click here for our visualization of the Bankruptcy Code (Title 11).  Click here for our visualization of Copyright (Title 17). While our prior efforts were devoted to displaying the structure of a given title of the US Code, the visualization above offers a complete view of the structure of the entire United States Code (Titles 1-50).

Using Zoomorama, each title is labeled with its respective number. The small black dots are “vertices” representing all sections in the aggregate US Code (~37,500 total sections). Given the size of the total undertaking, in the visual above, every title is represented to the “section level.”  As we described in earlier posts, a “section level” representation halts at the section and thus does not represent any of subsection depth.  For example, all sections under 26 U.S.C. § 501 including the well known § 501 (c) (3) are reattributed upward to their parent section.

There are two sources of structure within the United States Code. The explicitly defined structure / linkage / dependancy derives from the sections contained under a given title. The more nuanced version of structure is obtained from references or definitions contained within particular sections. This class of connections not only link sections within a given title but also connection sections across titles.  Within this above visual, we represent these important cross-title references by coloring them red.

Taken together, this full graph of the Untied States Code is quite large {i.e. directed graph (|V| = 37500, |E| = 197749)}. There exist 37,500 total sections distributed across the 50 Titles. However, these sections are not distributed in a uniform manner. For example, components such as Title 1 feature very few sections while Titles such as 26 and 42 contain many sections. The number of edges far outstrips the number of vertices with a total 197,000+ edges in the graph.

We are currently writing the paper on this subject … so please consider this the trailer. Above we offer the same visual of the United States Code (Titles 1-50) which we previously offered here … this time we are using Zoomorama. Zoomorama is an alternative to Seadragon which we believe might perform better on certain machine configurations.

If you click on the image above you should be taken straight to the full page image.  From there you should be click to zoom in and then read the titles … For those unfamiliar, please click here for the Zoomorama Instructions!

United States Court of Appeals & Parallel Tag Clouds from IBM Research

Ct of Appeals

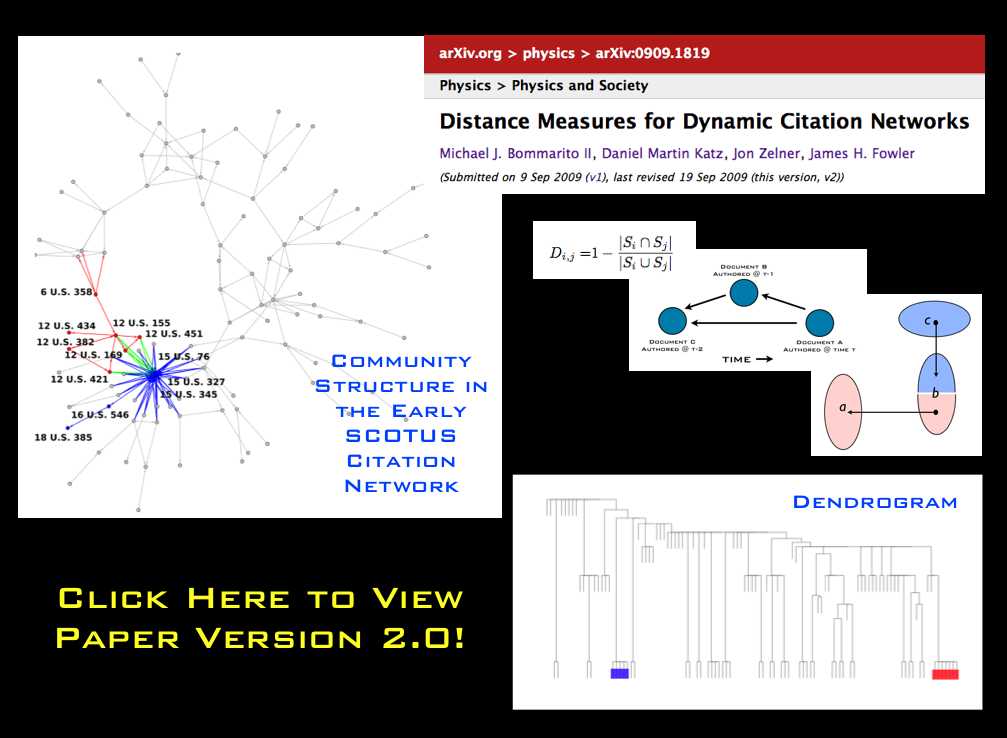
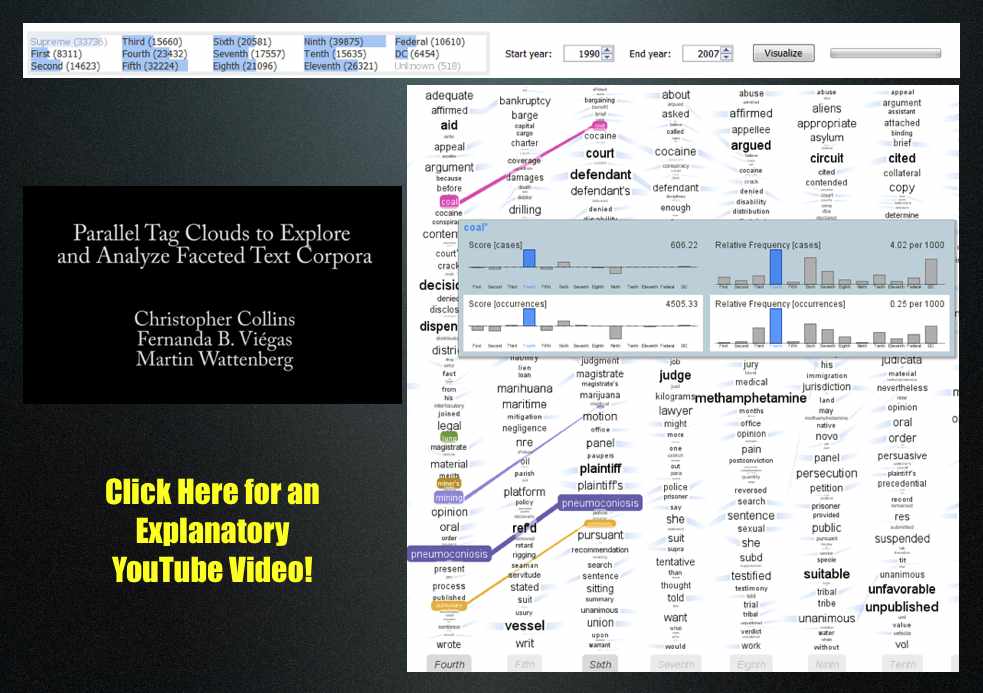
Download the paper: Collins, Christopher; Viégas, Fernanda B.; Wattenberg, Martin. Parallel Tag Clouds to Explore Faceted Text Corpora To appear in Proceedings of the IEEE Symposium on Visual Analytics Science and Technology (VAST), October, 2009. [Note: The Paper is 24.5 MB]

Here is the abstract: Do court cases differ from place to place? What kind of picture do we get by looking at a country’s collection of law cases? We introduce Parallel Tag Clouds: a new way to visualize differences amongst facets of very large metadata-rich text corpora. We have pointed Parallel Tag Clouds at a collection of over 600,000 US Circuit Court decisions spanning a period of 50 years and have discovered regional as well as linguistic differences between courts. The visualization technique combines graphical elements from parallel coordinates and traditional tag clouds to provide rich overviews of a document collection while acting as an entry point for exploration of individual texts. We augment basic parallel tag clouds with a details-in-context display and an option to visualize changes over a second facet of the data, such as time. We also address text mining challenges such as selecting the best words to visualize, and how to do so in reasonable time periods to maintain interactivity.

A Statistical Mechanics Take on No Child Left Behind — Flow and Diffusion of High-Stakes Test Scores [From PNAS]

PNAS NCLB

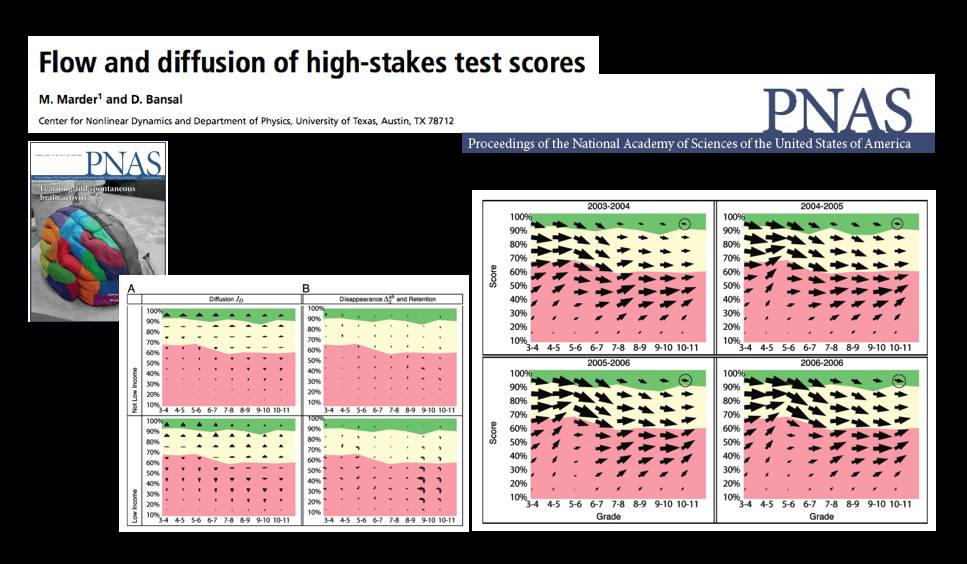
The October 13th Edition of the Proceedings of the National Academy of Science features a very interesting article by Michael Marder and Dhruv Bansal from the University of Texas.

From the article … “Texas began testing almost every student in almost every public school in grades 3-11 in 2003 with the Texas Assessment of Knowledge and Skills (TAKS). Every other state in the United States administers similar tests and gathers similar data, either because of its own testing history, or because of the Elementary and Secondary Education Act of 2001 (No Child Left Behind, or NCLB). Texas mathematics scores for the years 2003 through 2007 comprise a data set involving more than 17 million examinations of over 4.6 million distinct students. Here we borrow techniques from statistical mechanics developed to describe particle flows with convection and diffusion and apply them to these mathematics scores. The methods we use to display data are motivated by the desire to let the numbers speak for themselves with minimal filtering by expectations or theories.

The most similar previous work describes schools using Markov models. “Demographic accounting” predicts changes in the distribution of a population over time using Markov models and has been used to try to predict student enrollment year to year, likely graduation times for students, and the production of and demand for teachers. We obtain a more detailed description of students based on large quantities of testing data that are just starting to become available. Working in a space of score and time we pursue approximations that lead from general Markov models to Fokker–Planck equations, and obtain the advantages in physical interpretation that follow from the ideas of convection and diffusion.”