Click to view the full image.
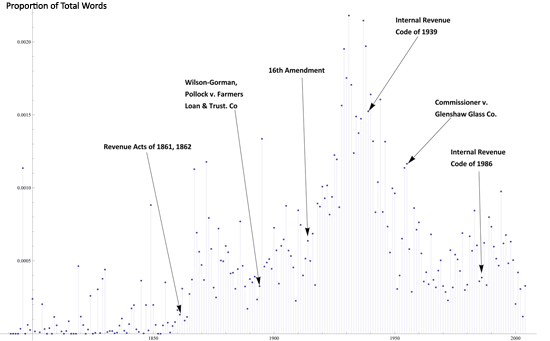
In honor of Tax Day, we’ve produced a simple time series representation of the Supreme Court and tax. The above plot shows the how often the word “tax” occurs in the cases of the Supreme Court, for each year – that is, what proportion of all words in every case in a given year are the word “tax.” The data underneath includes non-procedural cases from 1790 to 2004. The arrows highlight important legislation and cases for income tax as well.
Make sure to click through the image to view the full size.
Happy Tax Day!

