Science is a network, each paper linking those that came before with those that followed. In an exclusive analysis, researchers have delved into Nature’s part of that network. We explore their results, taking you on a tour of 150 years of interconnected, interdisciplinary research, as represented by Nature’s publication record.
Tag: visualization
Visual Epidemic Calculator
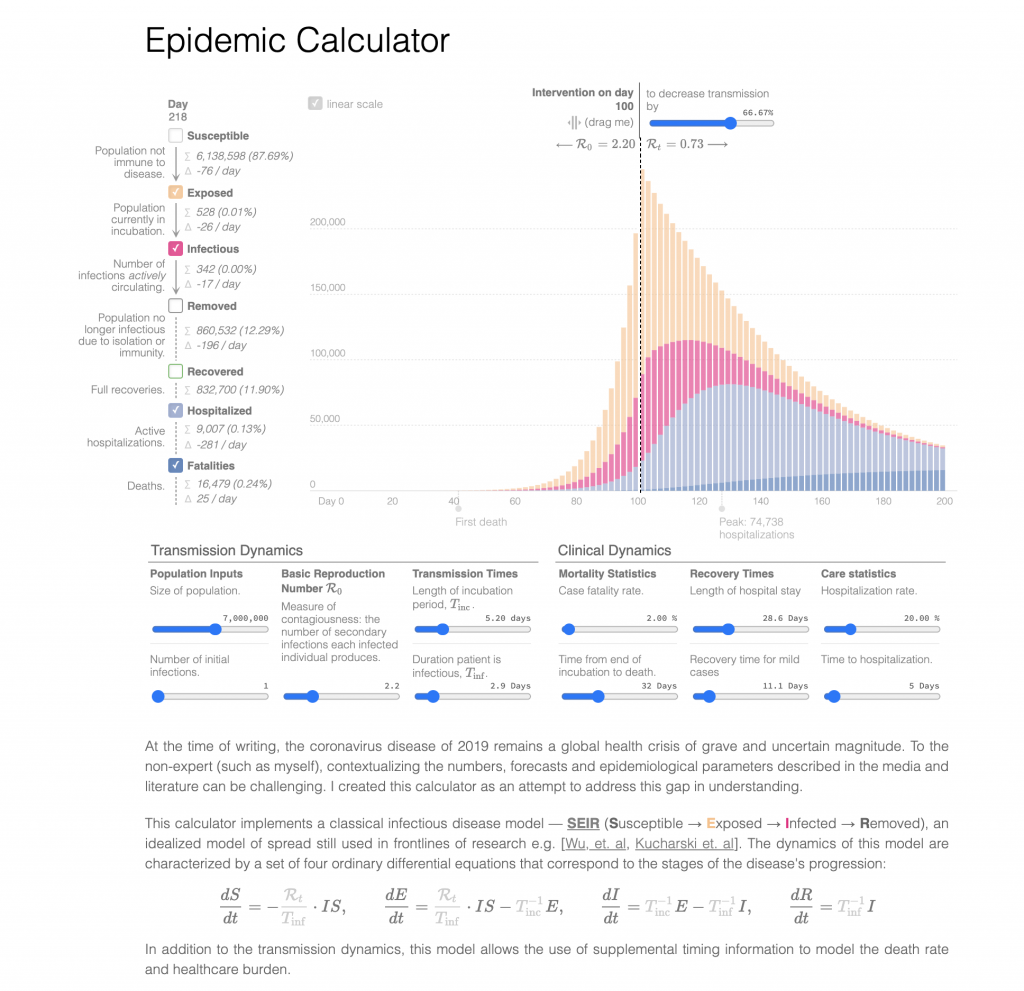
From the Epidemic Calculator – “The clinical dynamics in this model are an elaboration on SEIR that simulates the disease’s progression at a higher resolution, subdividing I,RI,R into mild (patients who recover without the need for hospitalization), moderate (patients who require hospitalization but survive) and fatal (patients who require hospitalization and do not survive). Each of these variables follows its own trajectory to the final outcome, and the sum of these compartments add up to the values predicted by SEIR. Please refer to the source code for details. Note that we assume, for simplicity, that all fatalities come from hospitals, and that all fatal cases are admitted to hospitals immediately after the infectious period.”
Humanity’s Cultural History Captured in 5-Minute Film (via Science)
More coverage is here. This builds upon ideas that were expressed at the High Throughput Humanities track at the 2010 European Complex Systems Conference.
Visual Law Services are Worth a Thousand Words—and Big Money (via ABA Journal)
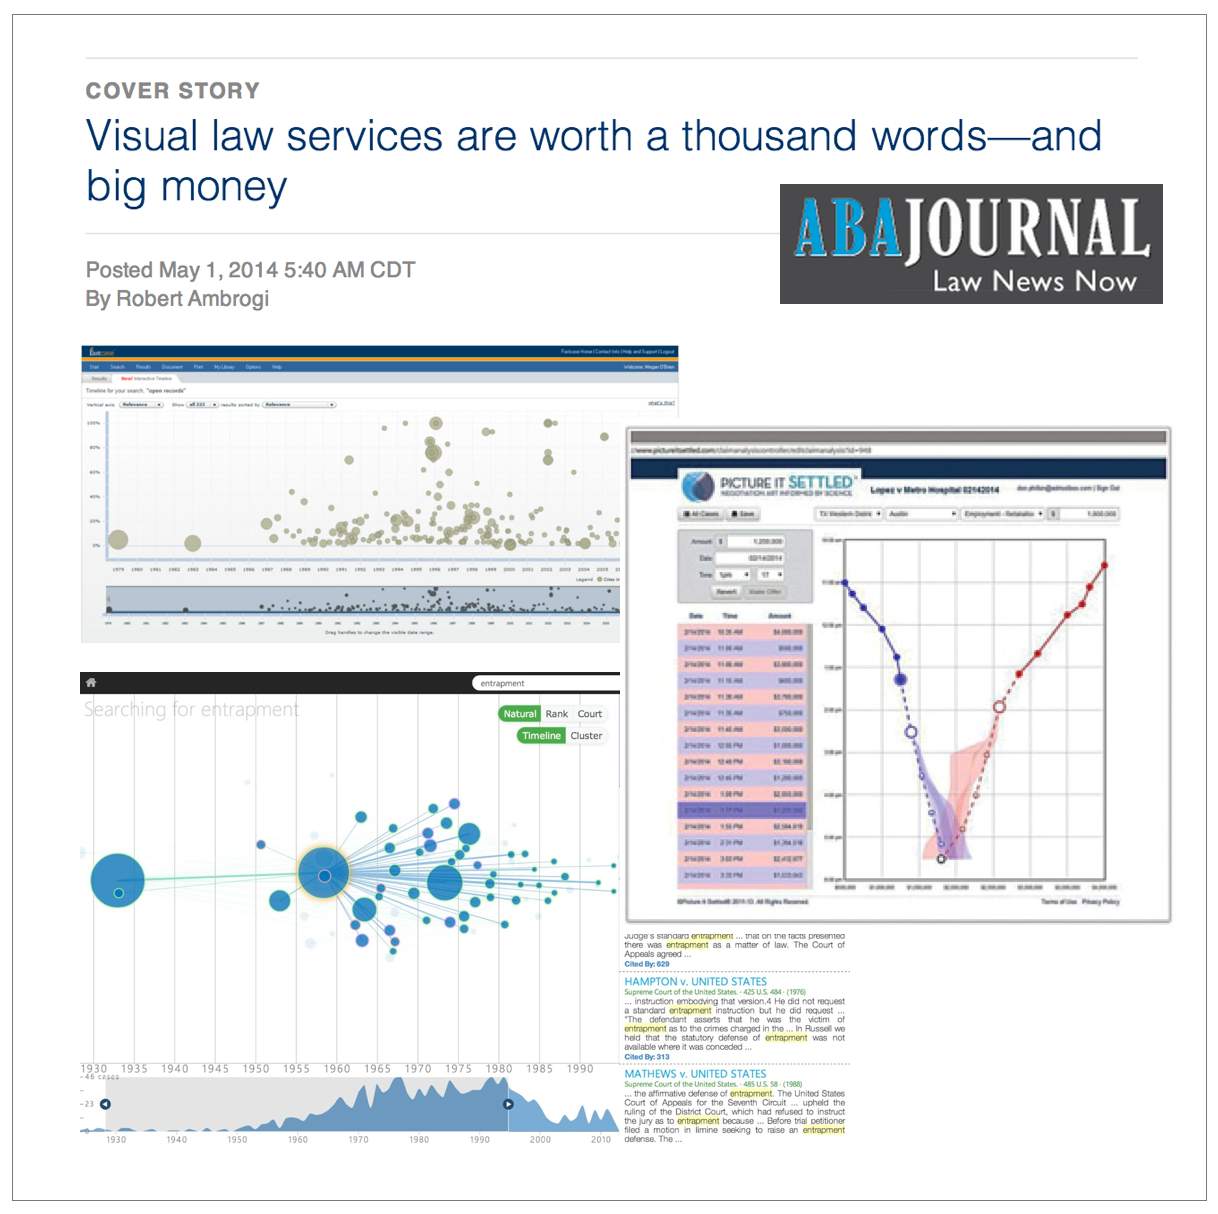
Mike and I have been on this beat for quite a while and are happy to see this getting coverage. The basic proposition is that dashboards, histograms, network visualization, etc. allow the end user to more effectively identify the relevant data/information. Here are a few examples of work we have undertaken:
3D Hi-Def Visualization of the Structure in the Citation Network of the United States Supreme Court
Legal Language Explorer (Visualizing the n-gram space)
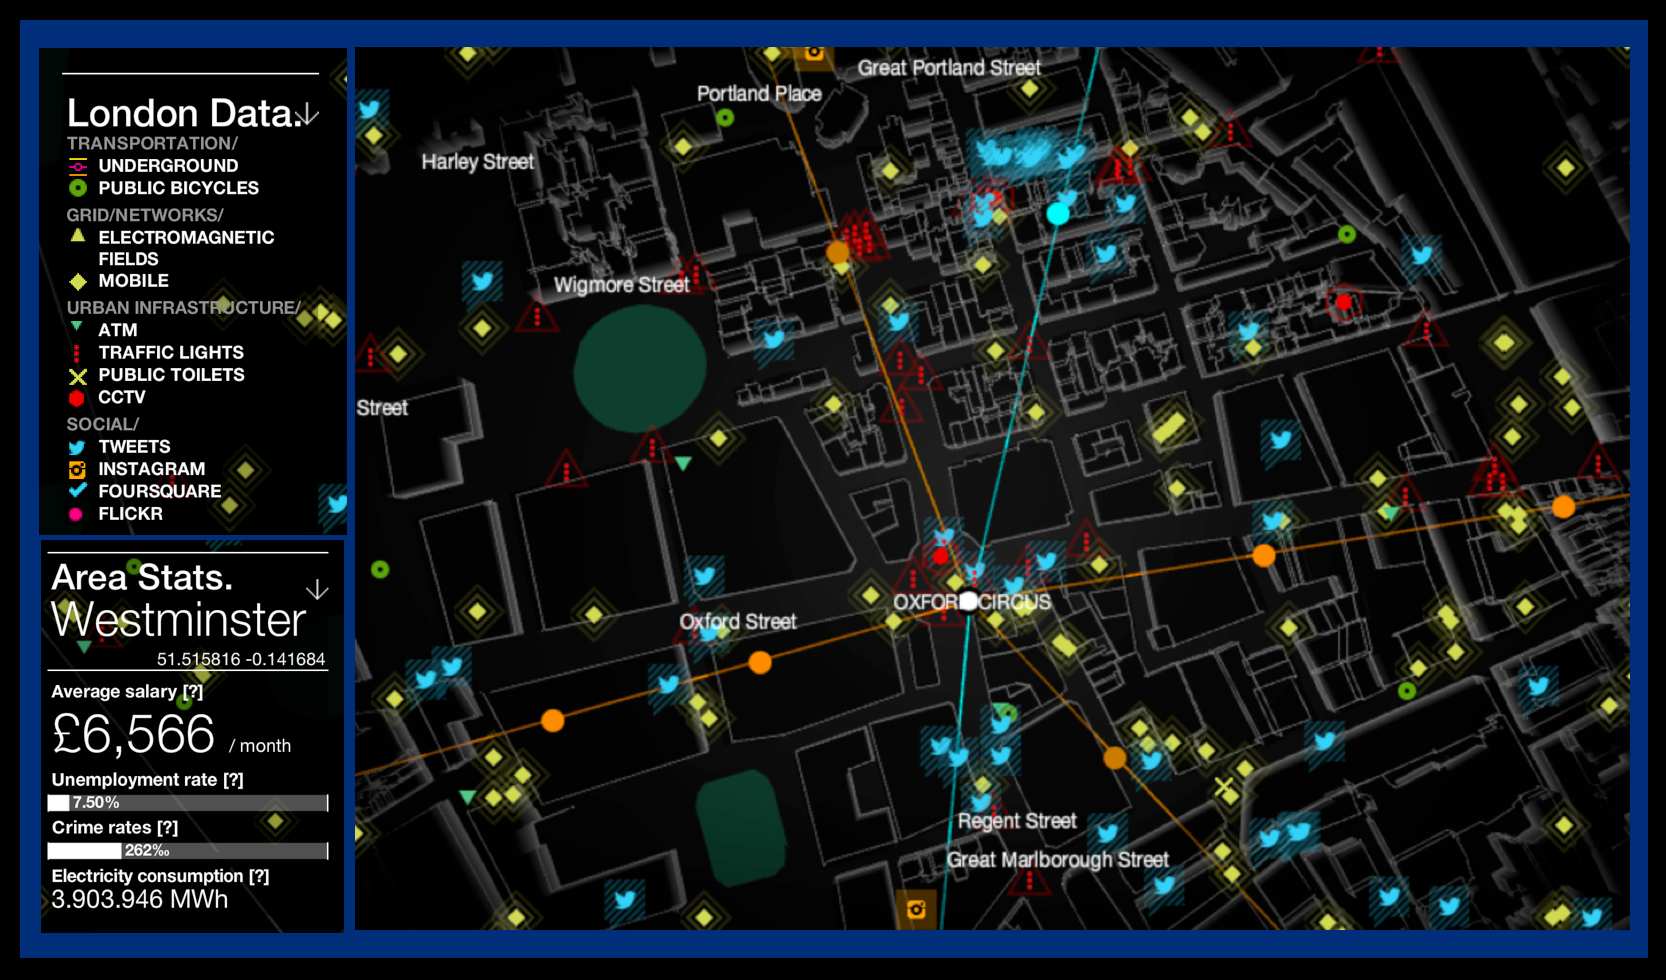
Leg/Ex – Legislative Explorer for Data Driven Discovery (Just One of Many User Interfaces for Legal / Political Institutions)
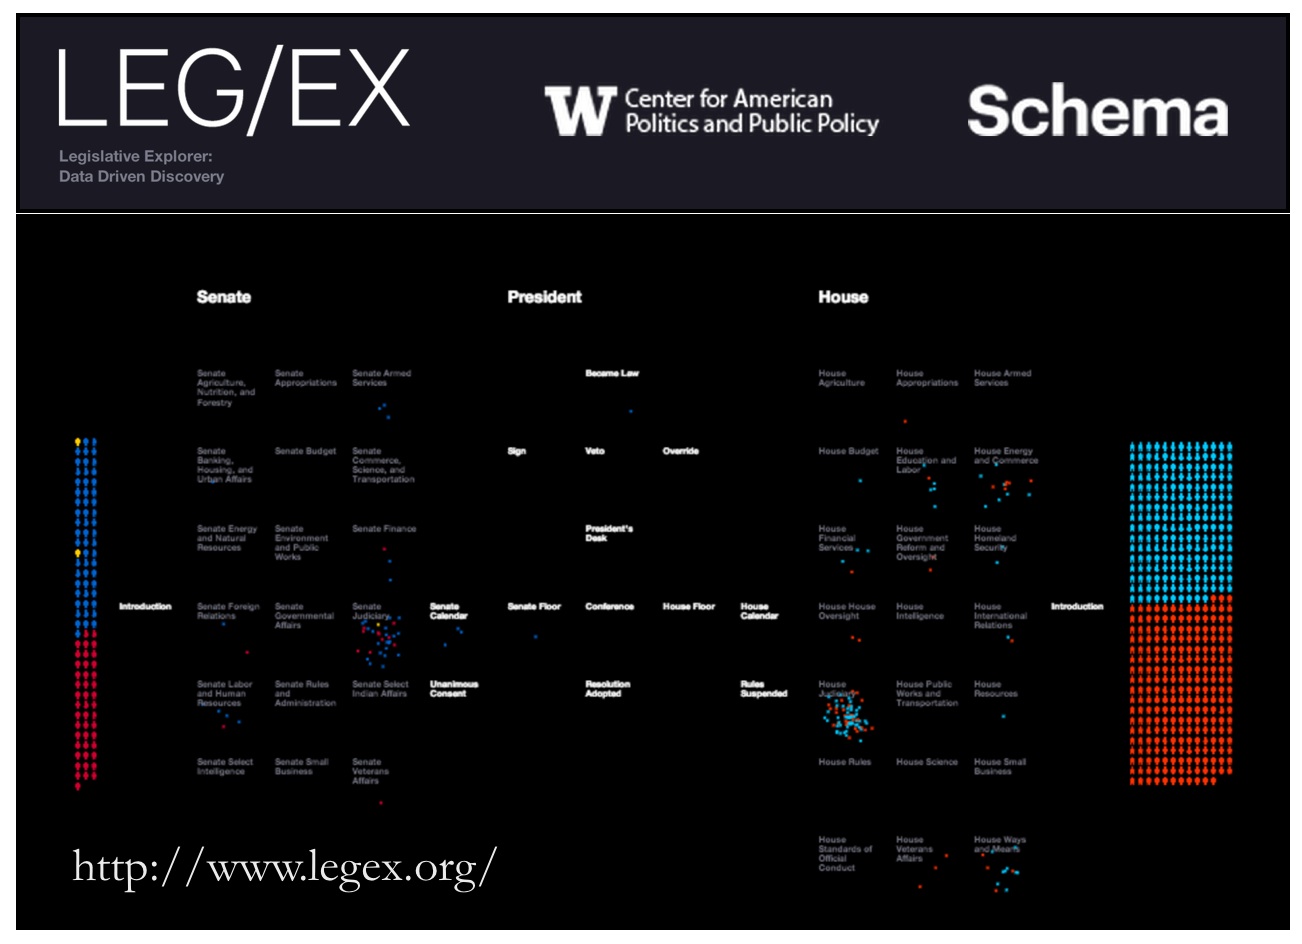 Lets face it – legal systems are complex. They are complex for the sophisticated players and even more complex for the average citizen. Complexity is the problem and the question which has been at the center of some of our recent work (see here) is how best to mediate that complexity.
For long periods of time, clients and legal stakeholders have dealt with complexity by allocating human capital to the problem. However, there are other tools/methods that might be employed to mediate legal complexity.
Reducing legal complexity is a question of information engineering and it is a question of design. Legal systems need a user interface such as the one displayed above. They need UI/UX. This is a major thrust of behind design thinking for lawyers and this is will be a major thrust of work (undertaken by lawyers and non-lawyers) over the coming years. Stay tuned!
(HT: Robert Richards, Ted Sichelman for flagging this project)
Rank and Filed – SEC Filings for Humans
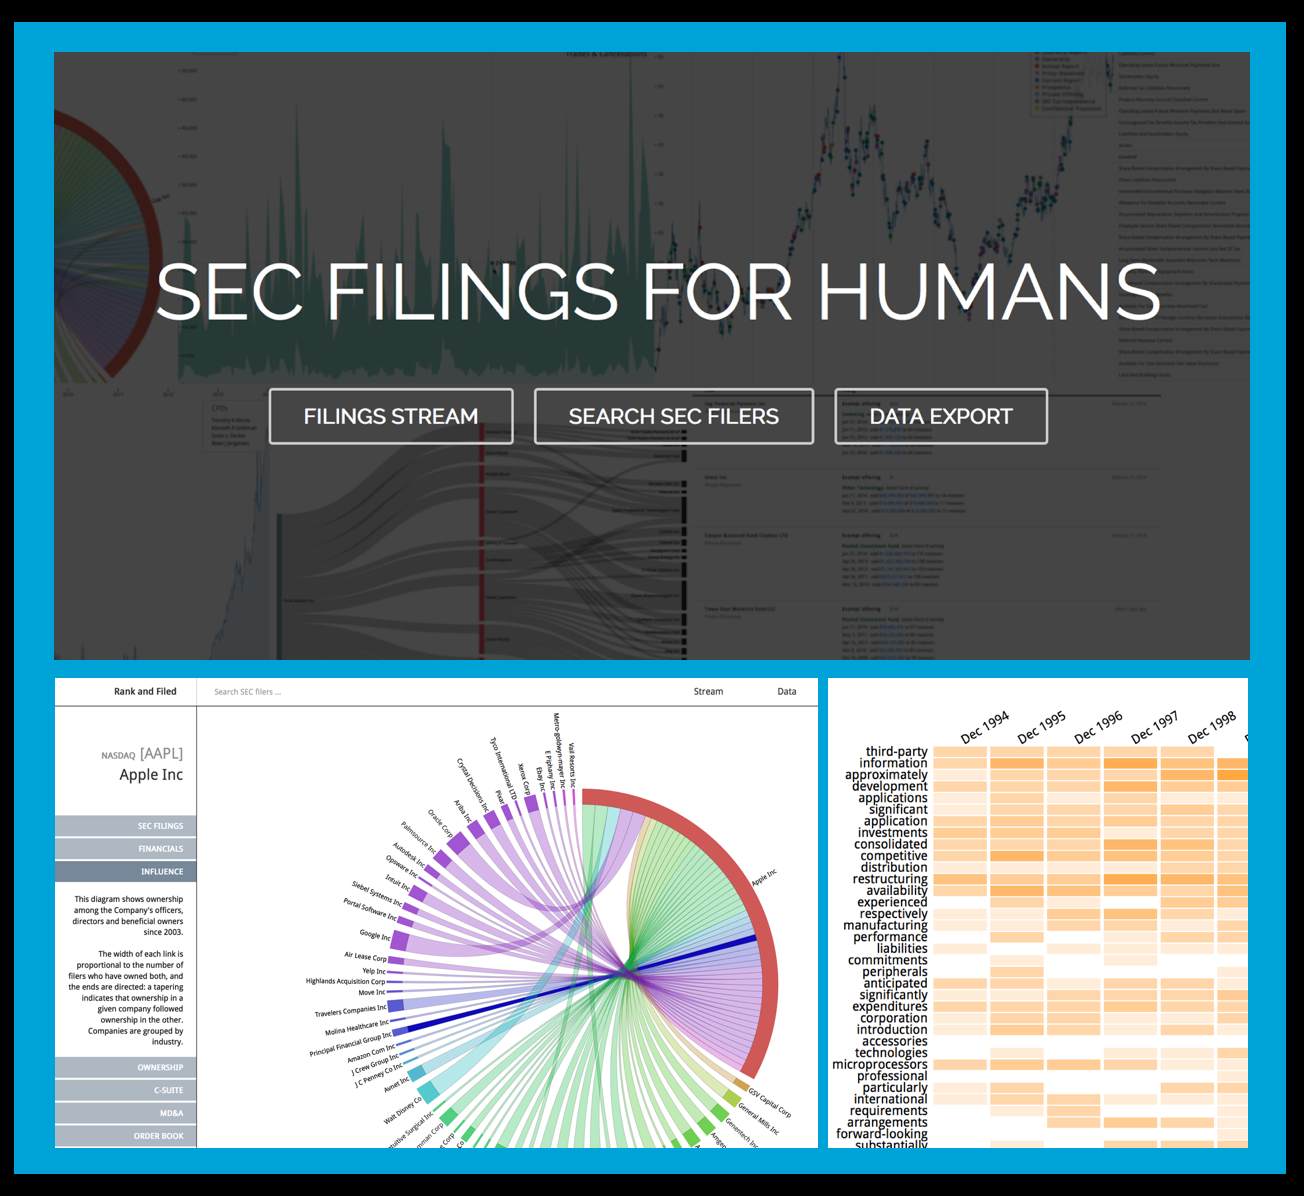 Really Impressive Work! – Read More Here. (HT to Ted Sichelman)
Network Analysis and the Law — 3D-Hi-Def Visualization of the Time Evolving Citation Network of the United States Supreme Court
What are some of the key takeaway points?
(1) The Supreme Court’s increasing reliance upon its own decisions over the 1800-1830 window.
(2) The important role of maritime/admiralty law in the early years of the Supreme Court’s citation network. At least with respect to the Supreme Court’s citation network, these maritime decisions are the root of the Supreme Court’s jurisprudence.
(3) The increasing centrality of decisions such as Marbury v. Madison, Martin v. Hunter’s Lessee to the overall network.
The Development of Structure in the SCOTUS Citation Network
The visualization offered above is the largest weakly connected component of the citation network of the United States Supreme Court (1800-1829). Each time slice visualizes the aggregate network as of the year in question.
In our paper entitled Distance Measures for Dynamic Citation Networks, we offer some thoughts on the early SCOTUS citation network. In reviewing the visual above note ….“[T]he Court’s early citation practices indicate a general absence of references to its own prior decisions. While the court did invoke well-established legal concepts, those concepts were often originally developed in alternative domains or jurisdictions. At some level, the lack of self-reference and corresponding reliance upon external sources is not terribly surprising. Namely, there often did not exist a set of established Supreme Court precedents for the class of disputes which reached the high court. Thus, it was necessary for the jurisprudence of the United States Supreme Court, seen through the prism of its case-to-case citation network, to transition through a loading phase. During this loading phase, the largest weakly connected component of the graph generally lacked any meaningful clustering. However, this sparsely connected graph would soon give way, and by the early 1820’s, the largest weakly connected component displayed detectable structure.”
What are the elements of the network?
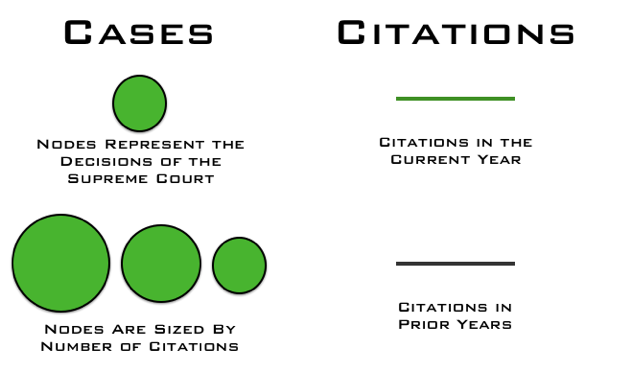
What are the labels?
To help orient the end-user, the visualization highlights several important decisions of the United States Supreme Court offered within the relevant time period:
Marbury v. Madison, 5 U.S. 137 (1803) we labeled as ”Marbury”
Murray v. The Charming Betsey, 6 U.S. 64 (1804) we labeled as “Charming Betsey” Martin v. Hunter’s Lessee, 14 U.S. 304 (1816) we labeled as “Martin’s Lessee”
The Anna Maria, 15 U.S. 327 (1817) we labeled as “Anna Maria”
McCulloch v. Maryland, 17 U.S. 316 (1819) we labeled as “McCulloch”
Why do cases not always enter the visualization when they are decided?
As we are interested in the core set of cases, we are only visualizing the largest weakly connected component of the United States Supreme Court citation network. Cases are not added until they are linked to the LWCC. For example, Marbury v. Madison is not added to the visualization until a few years after it is decided.
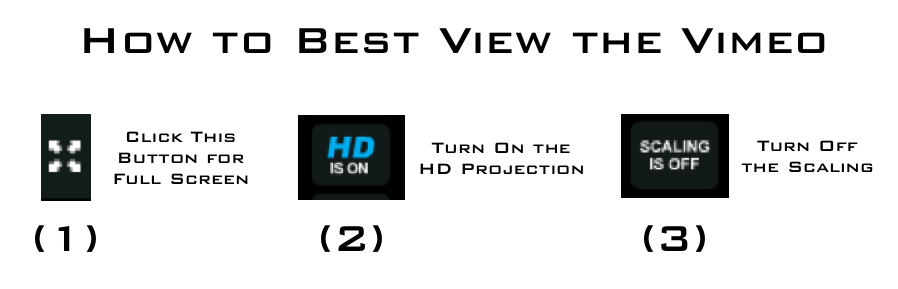
How do I best view the visualization?
Given this is a high-definition video, it may take few seconds to load. We believe that it is worth the wait. In our view, the video is best consumed (1) Full Screen (2) HD On (3) Scaling Off.
Where can I find related papers?
Here is a non-exhaustive list of related scholarship:
Daniel Martin Katz, Network Analysis Reveals the Structural Position of Foreign Law in the Early Jurisprudence of the United States Supreme Court (Working Paper – 2014)
Yonatan Lupu & James H. Fowler, Strategic Citations to Precedent on the U.S. Supreme Court, 42 Journal of Legal Studies 151 (2013)
Michael Bommarito, Daniel Martin Katz, Jon Zelner & James Fowler, Distance Measures for Dynamic Citation Networks, 389 Physica A 4201 (2010).
Michael Bommarito, Daniel Martin Katz & Jon Zelner, Law as a Seamless Web? Comparison of Various Network Representations of the United States Supreme Court Corpus (1791-2005) in Proceedings of the 12th Intl. Conference on Artificial Intelligence and Law (2009).
Frank Cross, Thomas Smith & Antonio Tomarchio, The Reagan Revolution in the Network of Law, 57 Emory L. J. 1227 (2008).
James Fowler & Sangick Jeon, The Authority of Supreme Court Precedent, 30 Soc. Networks 16 (2008).
Elizabeth Leicht, Gavin Clarkson, Kerby Shedden & Mark Newman, Large-Scale Structure of Time Evolving Citation Networks, 59 European Physics Journal B 75 (2007).
Thomas Smith, The Web of the Law, 44 San Diego L.R. 309 (2007).
James Fowler, Timothy R. Johnson, James F. Spriggs II, Sangick Jeon & Paul J. Wahlbeck, Network Analysis and the Law: Measuring the Legal Importance of Precedents at the U.S. Supreme Court, 15 Political Analysis, 324 (2007).
A Nice Visual Presentation of Simpson’s Paradox (via Vudlab @ UCBerkeley)
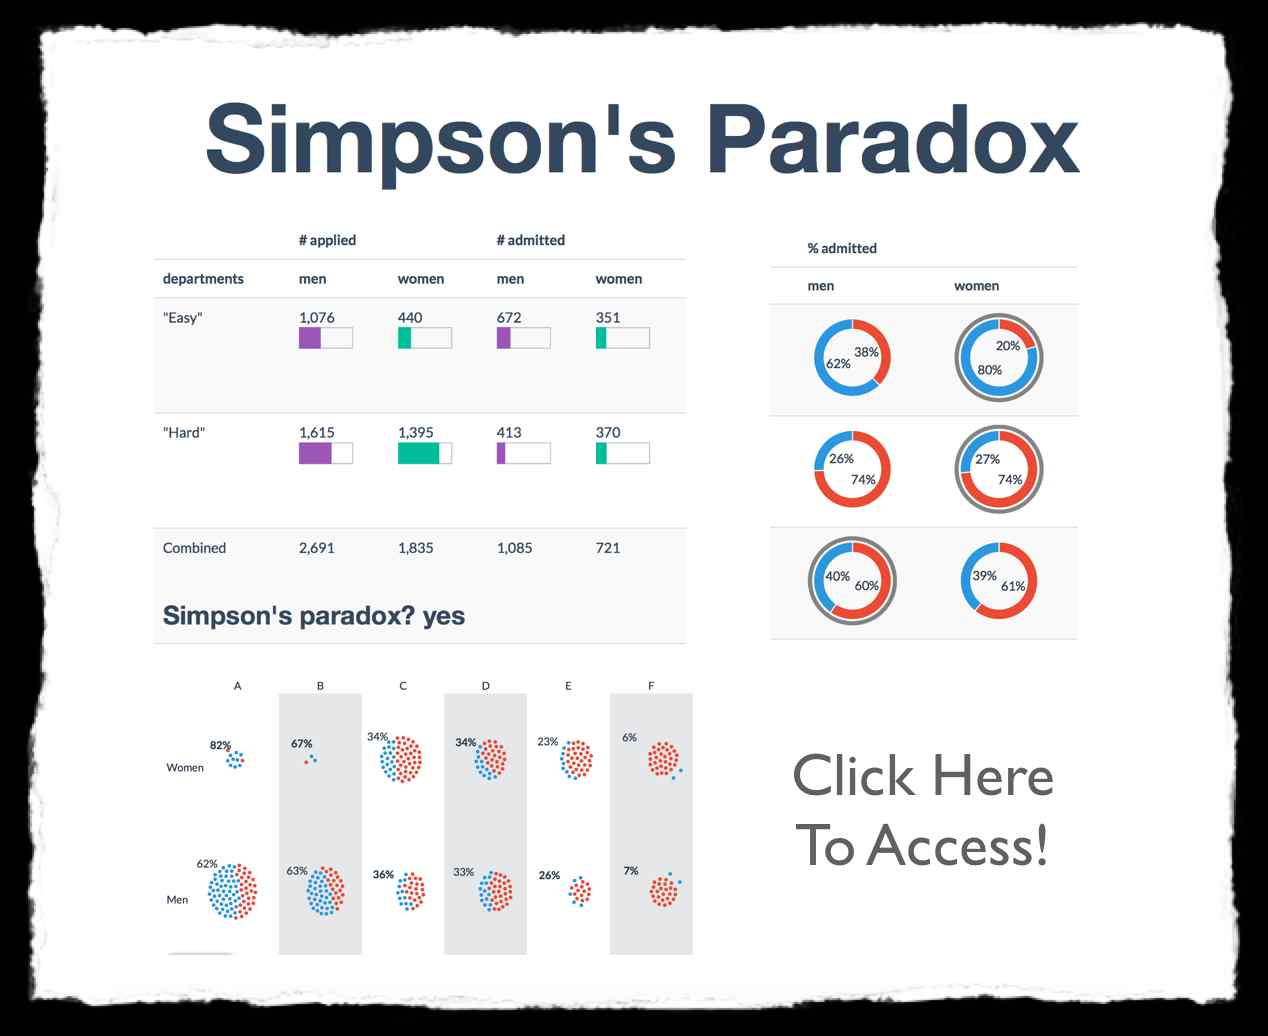 “In 1973, the University of California-Berkeley was sued for sex discrimination. The numbers looked pretty incriminating: the graduate schools had just accepted 44% of male applicants but only 35% of female applicants. When researchers looked at the evidence, though, they uncovered something surprising:
If the data are properly pooled…there is a small but statistically significant bias in favor of women.
By “properly pooled,” the investigators at Berkeley meant “broken down by department.” Men more often applied to science departments, while women inclined towards humanities. Science departments require special technical skills but accept a large percentage of qualified applicants. In contrast, humanities departments only require a standard undergrad curriculum but have fewer slots.”
Global Patent Map Reveals the Structure of Technological Progress (via MIT Technology Review)
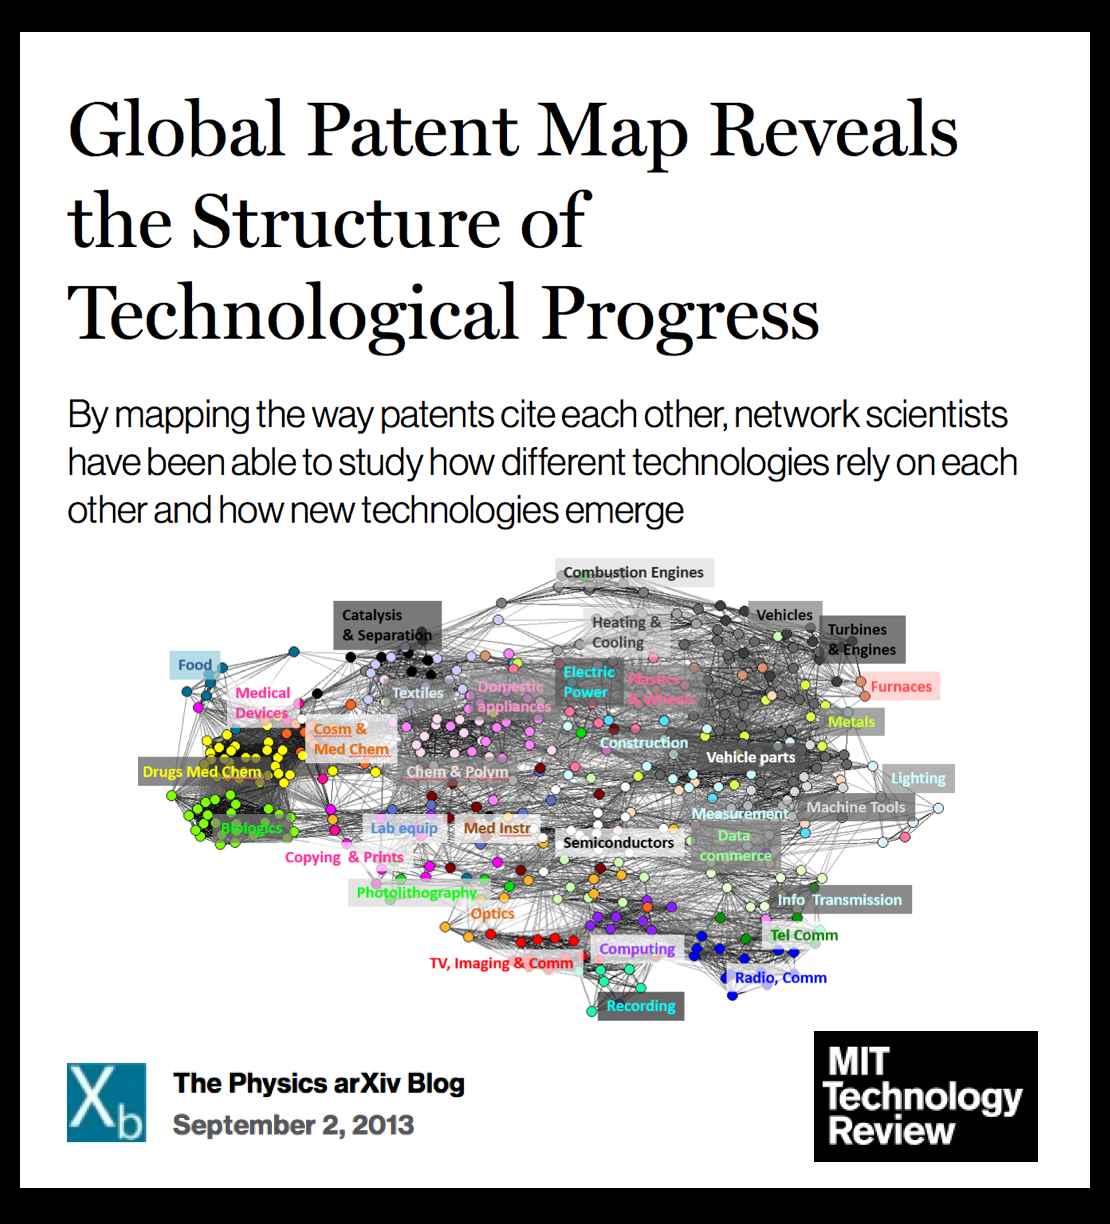 This is topic of great interest for a number of reasons. Mike, Jon and I have several papers in this basic direction (with hopefully more coming soon). Probably the most relevant of our paper is “Distance Measures for Dynamic Citation Networks” which we published in Physica A back in late-2010. For those who might be interested – a copy of our paper (with James H. Fowler) is available on SSRN and on ArXiv.