
Tag: visualization
Open Law Lab (By Margaret Hagan)
 Check Out – Open Law Lab (By Margaret Hagan – Student @ Stanford Law School). This is a welcome addition to the small but growing list below. However, this one is particularly important because it is entirely student created and driven!
- The Law Lab @ Harvard’s Berkman Center
(John Clippinger & Oliver Goodenough)
{To my knowledge, this is the first law laboratory ever created} - #ReInventLaw Laboratory @ Michigan State Law
(Daniel Katz & Renee Knake)
{We were the second law lab — founded in Early 2012} - Legal Innovation Lab @ Northeastern Law
(Luke Bierman & Martha Davis)
{This is the third lab — founded in the Fall 2012}
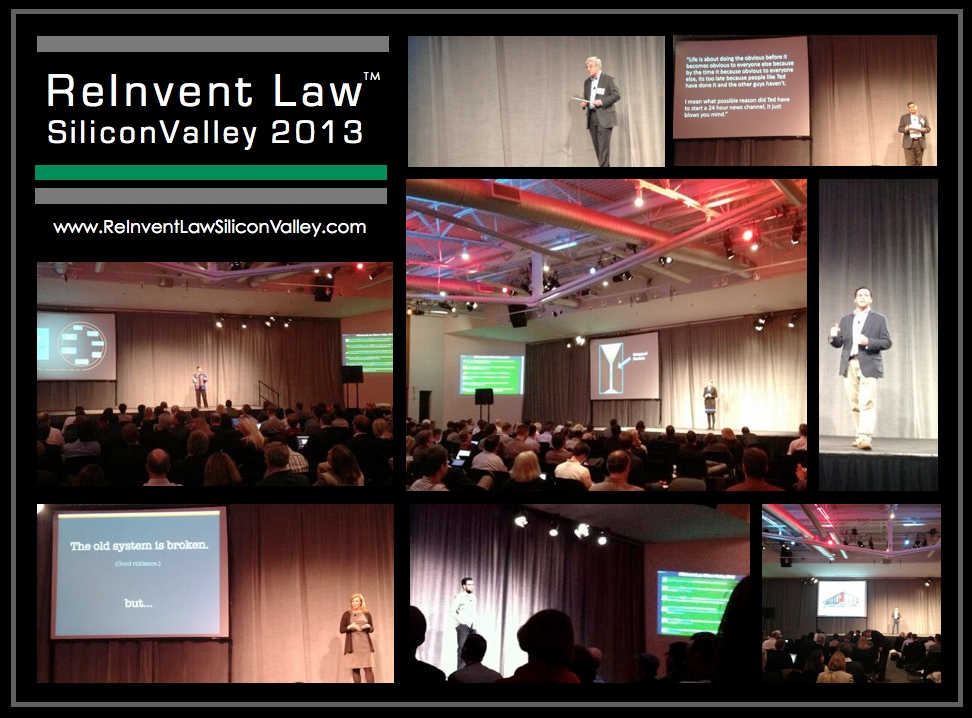
RoundUp of Coverage of ReInvent Law Silicon Valley 2013 – More Events Coming in 2013 and Beyond – Including ReInvent Law London + ReInvent Law New York
This is Hardly a Complete List but These Provide a Good Overview ….
The Future of Law as Seen From Silicon Valley (The AmLaw Daily – Aric Press)
‘Law is Broken.’ Will These Legal Tech Gurus Bring About Change? (ABA Journal – Law Scribbler/Rachel M. Zahorsky)
Thoughts on the Future of Law from ReInvent Law – Silicon Valley 2013 (The Legal Whiteboard – Jerry Organ)
ReInvent Law is a Really Big Deal (The Legal Whiteboard – Bill Henderson)
ReInvent Law Recap: A Speaker’s and Attendee’s Perspective (The Bionic Lawyer – Kevin Colangelo)
Twitter Recap of #ReInventLaw Silicon Valley (Innov8Social)
Five Core Themes of Legal Services Industry Reinvention (Legal 2050 Blog – J.B. Ruhl)
New Perspectives on the Legal Sector (Virtual Intelligence)
Enough Pain?: Time to Reinvent Law (ERM Legal Solutions – Larry Bridgesmith)
Live Blogging from ReInvent Law Silicon Valley 2013 (Prism Legal – Ron Friedmann)
Archived Tweets and Other Resources from #ReInventLaw Silicon Valley 2013 (Legal Informatics Blog – RC Richards)
Couple More Things …
Here is the Conference Website
Here is the Official Schedule of Presentations from March 8, 2013
And Finally More Events Coming in 2013 …
ReInventLaw London – June 14, 2013
ReInvent Law New York – Fall 2013
3 Thoughts on E-Discovery in 2015 and Beyond – LegalTechNYC 2013 – ( Daniel Martin Katz + Michael J. Bommarito II )
The focus of my panel was “E-Discovery in 2015 and Beyond.” My Panel included: The Honorable Faith Hochberg, United States District Court for the District of New Jersey; Joe Looby, FTI Technology & Dawn Hall, FTI Consulting. As was true last year, I was the only Law Professor asked to speak at an event which draws more than 12,000 attendees from many of the law divisions of the Fortune 500, many of the law firms in the AmLaw100 / NLJ 250 and the large number of emerging legal technology companies which as Bill Henderson noted are not really being held back by Rule 5.4.
Google Glass – One Day …
Having recently tried the Google Glasses during my visit to the Bay Area – I am pretty excited for the day displayed above!
Le Graph du Code Civil en Ligne – Interactive Network Visualization of French Civil Code
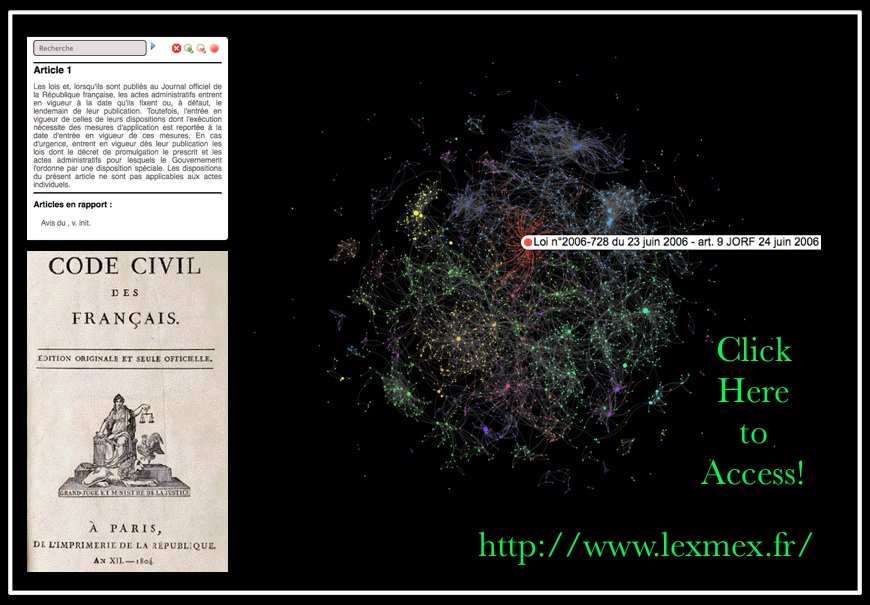 <HT: Robert Richards from Legal Informatics Blog >
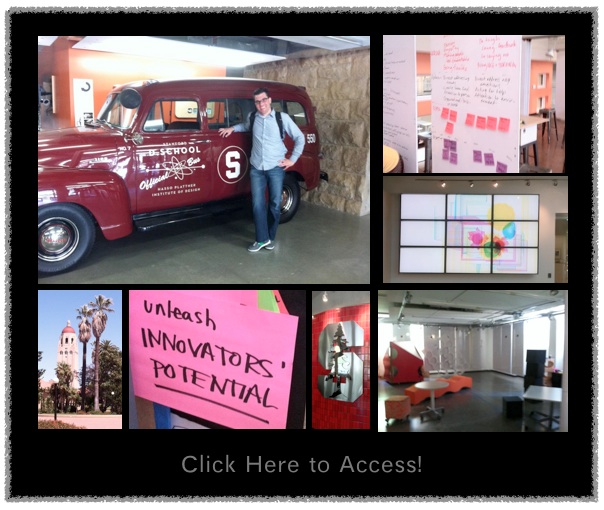
Forget B-School: D-School Is Hot { via Wall Street Journal }
How Recruiters Look at Your Resume {via The Ladders}
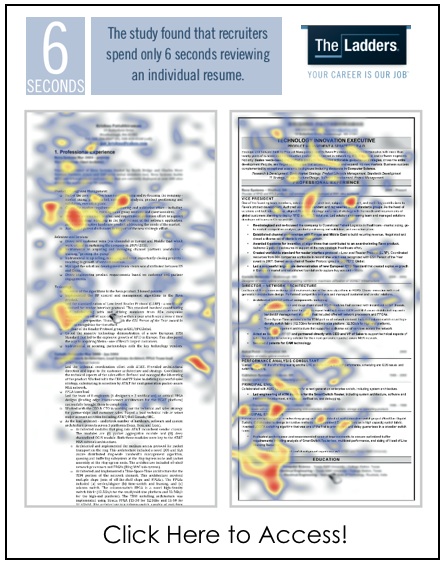
Small N here (n=30) but it is still worthy of consideration. {HT Flowing Data}
6,000 Pages Tell the World’s History [via GE Data Visualization]
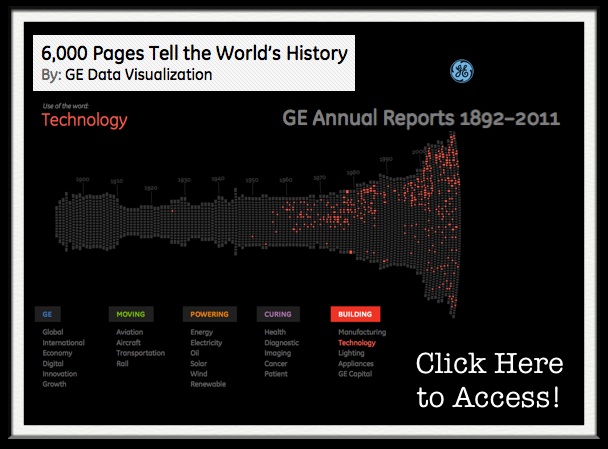 “It’s true. We’ve scanned 6,000 pages of GE’s annual reports to build this interactive visualization. But why? What’s the point? Not only does this provide a rich history of how GE has always been at work building, moving, powering and curing the world, but it is a true reflection of how the economy, U.S. and the world as a whole has progressed from 1892 until 2011. By diving deep into key terms, users can uncover interesting stories about innovation over the last century. Explore for yourself!
About this data: The data in this visualization is sourced from all of GE’s annual reports from 1892 until 2011.”
Interactive Dynamics for Visual Analysis (By Jeffrey Heer & Ben Shneiderman)

From the Abstract: “The increasing scale and availability of digital data provides an extraordinary resource for informing public policy, scientific discovery, business strategy, and even our personal lives. To get the most out of such data, however, users must be able to make sense of it: to pursue questions, uncover patterns of interest, and identify (and potentially correct) errors. In concert with data-management systems and statistical algorithms, analysis requires contextualized human judgments regarding the domain-specific significance of the clusters, trends, and outliers discovered in data.
Visualization provides a powerful means of making sense of data. By mapping data attributes to visual properties such as position, size, shape, and color, visualization designers leverage perceptual skills to help users discern and interpret patterns within data. A single image, however, typically provides answers to, at best, a handful of questions. Instead, visual analysis typically progresses in an iterative process of view creation, exploration, and refinement. Meaningful analysis consists of repeated explorations as users develop insights about significant relationships, domain-specific contextual influences, and causal patterns. Confusing widgets, complex dialog boxes, hidden operations, incomprehensible displays, or slow response times can limit the range and depth of topics considered and may curtail thorough deliberation and introduce errors. To be most effective, visual analytics tools must support the fluent and flexible use of visualizations at rates resonant with the pace of human thought.
The goal of this article is to assist designers, researchers, professional analysts, procurement officers, educators, and students in evaluating and creating visual analysis tools. We present a taxonomy of interactive dynamics that contribute to successful analytic dialogues.” [HT: Flowing Data]