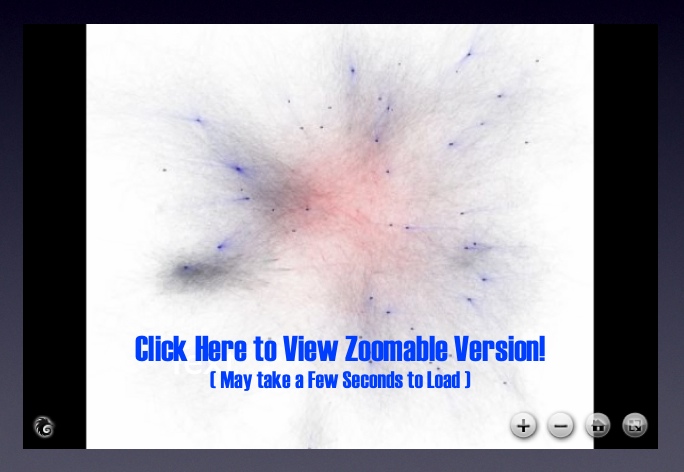
Formally organized into 50 titles, the United States Code is the repository for federal statutory law. While each of the 50 titles define a particular substantive domain, the structure within and across titles can be represent as a graph/network. In a series of prior posts, we offered visualizations at various “depths” for a number of well know U.S.C. titles. Click here and click Here for our two separate visualizations of the Tax Code (Title 26). Click here for our visualization of the Bankruptcy Code (Title 11). Click here for our visualization of Copyright (Title 17). While our prior efforts were devoted to displaying the structure of a given title of the US Code, the visualization above offers a complete view of the structure of the entire United States Code (Titles 1-50).
Using Seadragon from Microsoft Labs, each title is labeled with its respective number. The small black dots are “vertices” representing all sections in the aggregate US Code (~37,500 total sections). Given the size of the total undertaking, in the visual above, every title is represented to the “section level.” As we described in earlier posts, a “section level” representation halts at the section and thus does not represent any of subsection depth. For example, all sections under 26 U.S.C. § 501 including the well known § 501 (c) (3) are reattributed upward to their parent section.
There are two sources of structure within the United States Code. The explicitly defined structure / linkage / dependancy derives from the sections contained under a given title. The more nuanced version of structure is obtained from references or definitions contained within particular sections. This class of connections not only link sections within a given title but also connection sections across titles. Within this above visual, we represent these important cross-title references by coloring them red.
Taken together, this full graph of the Untied States Code is quite large {i.e. directed graph (|V| = 37500, |E| = 197749)}. There exist 37,500 total sections distributed across the 50 Titles. However, these sections are not distributed in a uniform manner. For example, components such as Title 1 feature very few sections while Titles such as 26 and 42 contain many sections. The number of edges far outstrips the number of vertices with a total 197,000+ edges in the graph.
 Seadragon has a number of nice features which enhance the experience of the end user. For example, a user can drag the image around by clicking and holding down the mouse button. Most importantly, is the symbol to the left. If you run your mouse over the above zoomable visual… look for this symbol to appear in the southeast corner. Click on it and it will make the visual full size… as you will see… the full size visual makes for a far more compelling HCI…


At full size, it gives a nice feel for the size of the code. I’d love to see this side-by-side with the constitution and the CFR.