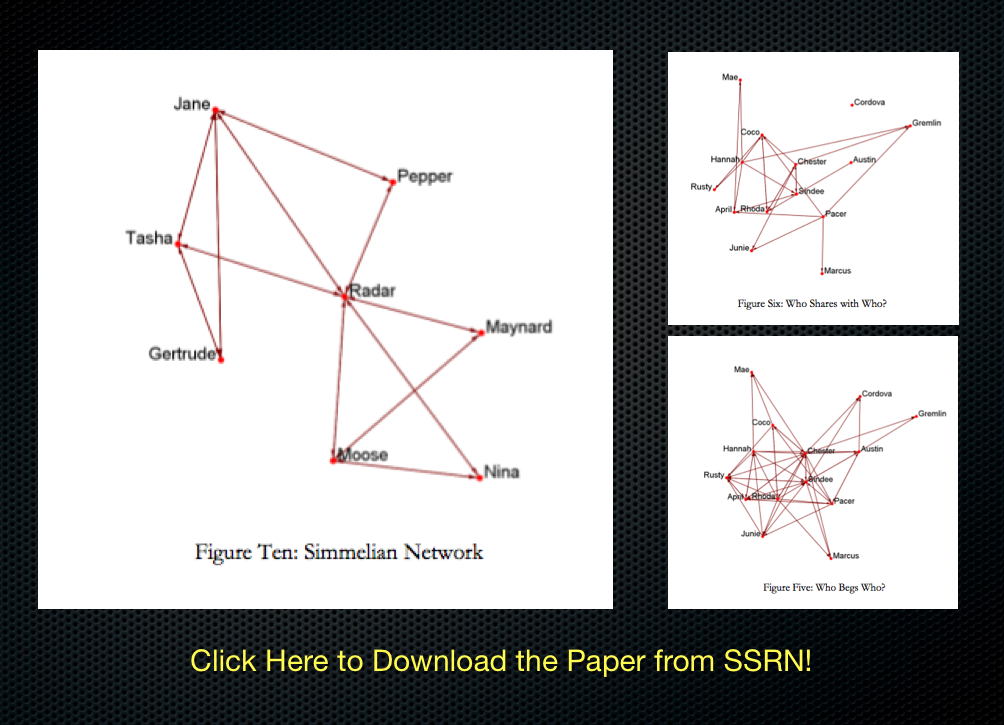
It was a long trip but we are looking forward to an exciting day of presentations at tomorrow’s Harvard Political Networks Conference. Check out the program! We hope to see you there.
Tag: network analysis
Measuring the Centrality of Federal Judges
Above are some graph statistics from our paper Hustle and Flow: A Social Network Analysis of the American Federal Judiciary. The paper measures the aggregated window of 1995-2005. These, of course, are not the only measures of centrality but they are commonly used in the network science literature. If you are interested — click through to the paper for a description of how these measures are calculated.
We believe these and other elements of the paper offer a good cut on the question of social prestige within the American Federal Judiciary. For example, in the paper we offer a graph visualization where Judge now Justice Alito as well as Judge turned Attorney General Michael Mukasey occupy an extremely central social position (just outside of the Top 25). We think this is useful because their social prestige is measured at a time period prior to their respective nominations. With appropriate control variables for the respective office in question … perhaps we might have been able to predict their nomination?
For purposes of the current Supreme Court opening and conditioned on the selection of a lower court justice with “blue team” credentials, we believe these graph statistics indicate Judge Sonia Sotomayor, Judge Merrick Garland , Judge William Fletcher & Judge David Tatel all occupy high levels of social prestige among their fellow judges and justices. Debate regarding qualifications of various individuals is likely to continue. While certainly not dispositive, we thought it appropriate to offer some social scientific evidence on the question.
President Obama might go outside the tradtional Federal Court of Appeals judge on this round. For example, Governor Jennifer Granholm, Solicitor General Elena Kagan and Homeland Security Secretary Janet Napolitano appear to be on the short list. However, keep these names in mind as this is probably not President Obama’s last nomination to the high court.
Jones & Brosnan: Local Interaction, Strategy Dynamics and the Emergence of Reciprocity in Chimpanzee Social Networks
Following up from the very interesting recent Society for Evolutionary Analysis in Law Conference (SEAL 10) at Vanderbilt Law School, I wanted to briefly highlight some compelling scholarship offered Greg Jones & Sarah Brosnan. In their paper, Social Contracts on Social Networks: Local Patterns of Interaction, Local Strategy Dynamics and the Emergence of Reciprocity they explore cooperative, prosocial behavior in chimpanzees. The paper is both empirical and computational in nature.
I recognize that primatology represents a novel domain for many social scientists and legal scholars. In the March (1991) framework, we here at the CLS Blog believe exploration of a wide number of intellectual domains should be privileged over the mere exploitation of current approaches. For those interesting in such exploration, please consider downloading and reading this article.
Visualizing Contributions to the 110th Congress — The House Edition
DOCUMENTATION FOR THE VISUALIZATION
University of Michigan
Center for the Study of Complex Systems
Department of Political Science
BASIC OVERVIEW:
110th Congress = January 3, 2007 – January 3, 2009
435 Voting Members of the United States House of Representatives + District of Columbia (Eleanor Holmes Norton) + Puerto Rico (Luis Fortuno) + Virgin Islands (Donna Christian-Green) + American Samoa (Eni F H Faleomavega) + Guam (Madeleine Z Bordallo)
Click here and here for the Senators of the 110th Congress.
BASIC RULE:
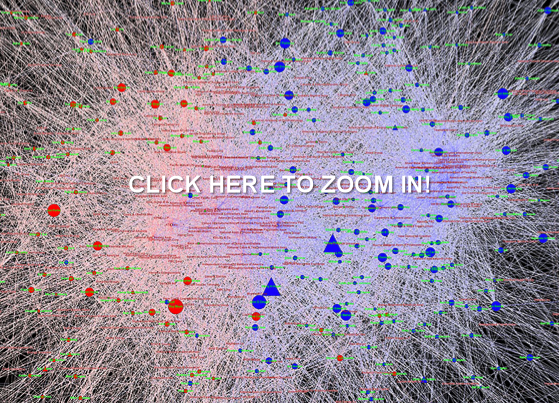
Squares (Institutions) Introduce Money into the System and Circles (Congressmen) Receive Money.
DATA OVERVIEW:
Using recently published data on campaign contributions collected by the Federal Election Commission and aggregated by the Center for Responsive Politics our visualizations track large money donations to members of the 110th Congress over the 2007 – 2008 window.
It is important to note that most of these organizations did not directly donate. Rather, as noted by the Center for Responsive Politics “the money came from the organization’s PAC, its individual members or employees or owners, and those individuals’ immediate families. Organization totals include subsidiaries and affiliates. Of course, it is impossible to know either the economic interest that made each individual contribution possible or the motivation for each individual giver. However, the patterns of contributions provide critical information for voters, researchers and others.”
The Center describes its methodology here http://www.opensecrets.org/politicians/method_pop.php.
To provide for an optically tractable view of the top contributions, we follow the CRP and impose the limiting requirement that to be included in our tally a given group’s contribution must fall within a given house members top contributor list.
We try to strike a tradeoff between information overload and incomplete disclosure.
In coming days, we will provide an additional visualization of the underlying data. Check back soon!
CONTRIBUTORS & CONTRIBUTIONS:
2,508 of the Donors are captured in the Graph.
Total Recorded Donations Introduced into our Visualization by these Entities Total to $113,134,698
(1) SIZING of the REPRESENTATIVE NODES — Each Circular node representing a Member of the House is sized according the amount of incoming donations. Thus, larger nodes are the recipients of larger sums of money while the smaller nodes received smaller amounts of money.

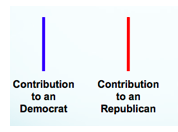
(2) COLORING and SHAPES of the REPRESENTATIVE NODES — Each node representing a Member of the United States House of Representatives is colored according their Political Party. Using popular convention, we color members of the Republican Party as Red and members of the Democratic Party as Blue.
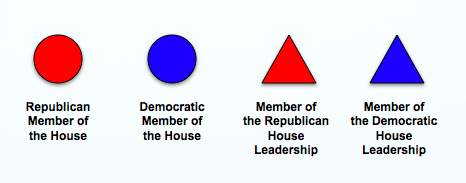
(3) SIZING of the CONNECTIONS — Each Connection (Arc) between an Institution and a Member of the House is sized according to the amount of money flowing through a connection. Darker connections represent larger flows of money while lighter connections represent smaller amounts of money.

(4) COLORING of the CONNECTIONS — Each connection representing a campaign contribution from an entity to a member of Congress is colored according to partisan affiliation of the receiving representatives. Using popular convention, we color members of the Republican Party as Red and members of the Democratic Party as Blue.
(5) STRUCTURE OF THE GRAPH — The Graph is Visualized Using Fruchterman-Reingold. This is an automated spring embedded, force directed placement algorithm often used in the network science literature to visualize graphs of this size.
(6) ACKNOWLEDGEMENTS — We thank Rick Riolo, Jon Zelner, Carl Simon, Scott Page and the Center for Responsive Politics for their comments, contributions and/or data.
Co-Sponsorship Networks– Senators of the 108th Congress
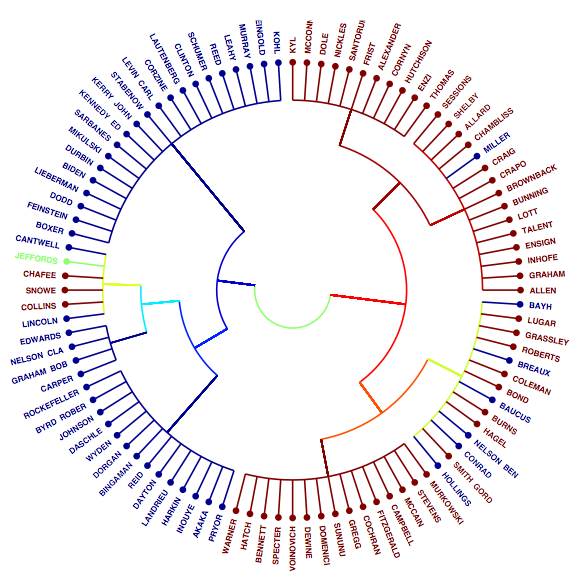
In the days and weeks to come we will turn our attenion away from Congress in favor of other institutions and substantive questions. However, given our prior posts focusing upon the structure of the 110th Congress, we thought it proper to highlight some relevant realted scholarship. James Fowler from the UCSD Political Science Department and leader of the Networks in Political Science movement has published several papers exploring the strucutre of legislative co-sponsorship. You can find a link to these papers here. My favorite of these papers is Community Structure in Congressional Cosponsorship Networks published in Physica A by Yan Zhang, A. J. Friend, Amanda L. Traud, Mason A. Porter, James H. Fowler & Peter J. Mucha. The above figure, drawn from the paper, is a dendrogram for the legislative cosponsorship network of the Senate of the 108th Congress.
Visualizing the Campaign Contributions to Senators in the 110th Congress — The TARP EDITION (The Image)
As part of our commitment to provide original content, we offer a Computational Legal Studies approach to the study of the current campaign finance environment. If you click below you can zoom in and read the labels on the institutions and the senators. The visualization memorializes contributions to the members of the 110th Congress (2007 -2009). Highlighted in green are the primary recipients of the TARP.
In the post below, we offer detailed documentation of this visualization.
Three Important Principles: (1) Squares (i.e. Institutions) introduce money into the system and Circles (i.e. Senators) receive money (2) Both Institutions and Senators are sized by dollars contributed or dollars received (3) Senators are colored by Party.
To view the full image, please click here.
To view the full image, please click here.
By Michael Bommarito and Daniel Martin Katz.
Center for the Study of Complex Systems
Department of Political Science
University of Michigan, Ann Arbor
Hustle & Flow: A Network Analysis of the American Federal Judiciary
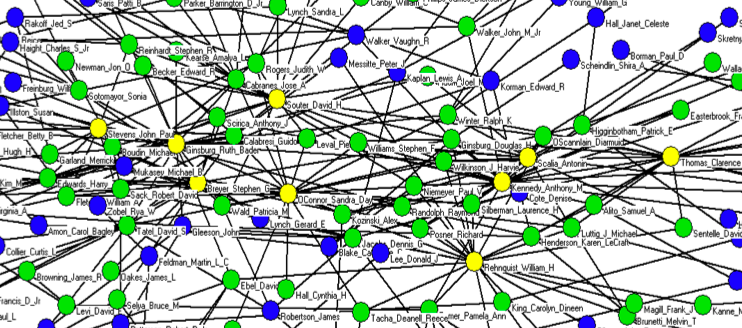
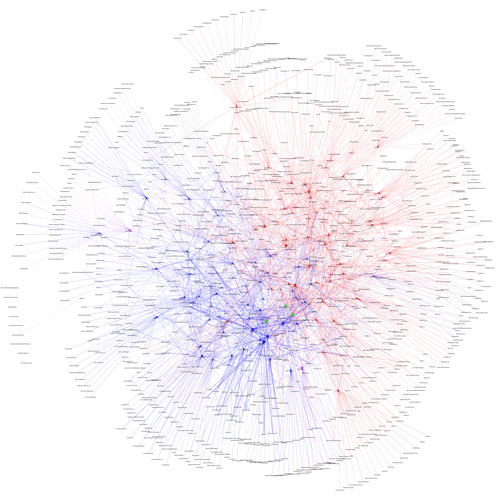
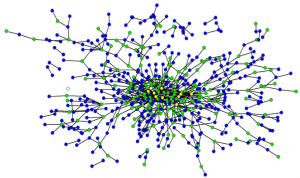
This paper written by CLS Blog Co-Founder Daniel Katz and Derek Stafford from the University of Michigan Department of Political Science representes an initial foray into Computational Legal Studies by the graduate students here at the University of Michigan Center for the Study of Complex Systems. The full paper contains a number of interesting visualizations where we draw various federal judges together on the basis of their shared law clerks (1995-2004). The screen print above is a zoom very center of the center of the network. Yellow Nodes represent Supreme Court Justices, Green Nodes represent Circuit Court Justices, Blue Nodes represent Circuit Court Justices. Here is a wide shot of the broader network visualized using the Kamada-Kawai visualization algorithm:
Here is the abstract: Scholars have long asserted that social structure is an important feature of a variety of societal institutions. As part of a larger effort to develop a fully integrated model of judicial decision making, we argue that social structure-operationalized as the professional and social connections between judicial actors-partially directs outcomes in the hierarchical federal judiciary. Since different social structures impose dissimilar consequences upon outputs, the precursor to evaluating the doctrinal consequences that a given social structure imposes is a descriptive effort to characterize its properties. Given the difficulty associated with obtaining appropriate data for federal judges, it is necessary to rely upon a proxy measure to paint a picture of the social landscape. In the aggregate, we believe the flow of law clerks reflects a reasonable proxy for social and professional linkages between jurists. Having collected available information for all federal judicial law clerks employed by an Article III judge during the “natural” Rehnquist Court (1995-2004), we use these roughly 19,000 clerk events to craft a series of network based visualizations. Using network analysis, our visualizations and subsequent analytics provide insight into the path of peer effects in the federal judiciary. For example, we find the distribution of “degrees” is highly skewed implying the social structure is dictated by a small number of socially prominent actors. Using a variety of centrality measures, we identify these socially prominent jurists. Next, we draw from the extant complexity literature and offer a possible generative process responsible for producing such inequality in social authority. While the complete adjudication of a generative process is beyond the scope of this article, our results contribute to a growing literature documenting the highly-skewed distribution of authority across the common law and its constitutive institutions.


