The MIT School of Law?

I have to admit that I got totally suckered by this April fools day post over at the Faculty Lounge. I did not carefully read all of the supporting details. So, (a) kudos for them for this great prank and (b) shame on me for skimming!

So I have been mulling it over a little bit … and although it was pitched as a joke … the MIT School of Law sounds like very interesting idea …

I guess part of why I was so willing to believe this post is because, in my estimation, it represented a good assessment of the state of the market for legal education. Namely, MIT School of Law seems like a plausible effort to capture and arguably better serve one particular subset of the market.

We live in the petabyte era and the impacts of the era of ‘big data’ are already remaking many sectors of the economy. It cannot be too long until the scope of available information fundamentally alters the market for legal services. Specifically, in terms of leveraging information technology to improve the quality and efficiency of legal services … my bet is on someone with an interest in attending the MIT Law School.

So, I know what you might be thinking… Isn’t it the case that lots of institutions offer courses and programs that would generally parallel those offered by MIT Law School?  Well, yes.

However, I believe that an MIT law school would arguably differ from existing offerings in two important ways:

(1) Given a selective pool of students with prior technical training … the emphasis upon science and technology, etc. could be much more extensive. Indeed, one could imagine a legal curriculum that strongly emphasized science, technology, statistical training, mathematical and computational modeling, etc.  There is a growing market for lawyers with this class of skills (but those jobs are currently in non-traditional places).

(2) Like in many other fields, a non-trivial amount of the substantive education is generated through peer-to-peer interaction outside of the classroom.  A culture that was exclusively or nearly exclusively devoted to the integration of law, technology, applied math, computer science as well as the social and physical sciences could arguably do a better job of nurturing the development of a particular subset of the broader law student population.

I want to make sure it is clear that this post is not a general affront to state of American legal education.  There are some serious issues in American legal education but I will leave this broader reform question to more qualified folks. Instead, this post is related to better serving a narrow slice of the market (i.e. law students with particular class of prior technical training).

Anyway, while this is probably not likely to come to pass … I still thought the idea was worthy of some sort of brief sketch … I mean if one thinks UC-Irvine has stormed the scene … seriously, think about what a MIT law school might be able to do!

 

The Clerkship Tournament: Supreme Court Edition [Repost from 6/3]

Picture 1

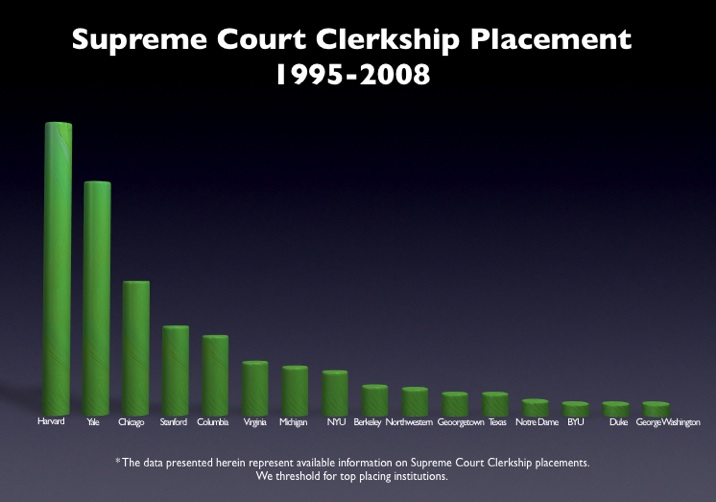
As part our multipart series on the clerkship tournament, here is a simple bar graph for the top placing law schools in the Supreme Court Clerkship Tourney. It is important to note that we do not threshold for the number of graduates per school. Specifically, we do not just divide by the number graduates per school because we have little theoretic reason to believe that placements linearly scale to differences in size of graduating classes. In other words, given we do not know the proper functional form — we just offer the raw data. For those interested in other posts, please click here for the law clerks tag.

Sea Dragon Visualization of the American Legal Academy


Here is another visual run through the SeaDragon Visualization from Microsoft Labs.  Similar to the Title 17 United States Code visual from earlier in the week, one can zoom in and out. Using the button in the far southeast corner it is possible to generate a full screen visual of the network.

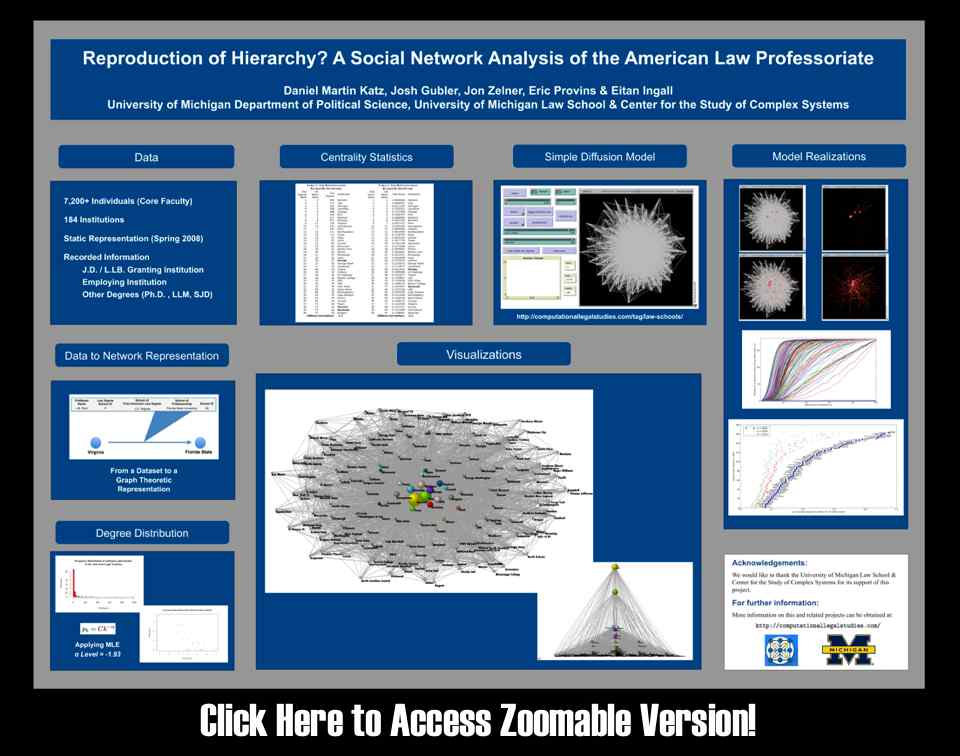
Pervious posts discussing this visualization are located  here and  here. In addition, results of our model of diffusion on the network are located here while an interactive version of the agent based model generated in Netlogo is located here.  For those interested in the full draft … it is entitled Reproduction of Hierarchy? A Social Network Analysis of the American Law Professoriate.

The Law Clerkship Tournament : The Expanded Edition

Federal Clerks (By School)

Our multipart series on the clerkship tournament continues above with an expanded edition of our underlying dataset.  It is important to note that we do not threshold for the number of graduates per school. Specifically, we do not just divide by the number graduates per school because we do not have any particular theoretic reason to believe that placements linearly scale to differences in size of graduating classes. In other words, given we do not know the proper functional form — we just offer the raw data for your consideration. For those interested in other posts, please click here for the law clerks tag. 

In the previous circuit/district post, we focused upon the “top” 15 schools as ranked by an older version of US News.  When we expand the analysis to consider a wider slice of institutions, two schools standout — Texas and Notre Dame.  Basically, the arbitrariness of the prior cut off we imposed did not really do justice to these institutions … this wider view provides a deeper indication of their standing relative to other institutions.  

Data on the Law Clerkship Tournament: Take 2

Circuit Clerk Tourney

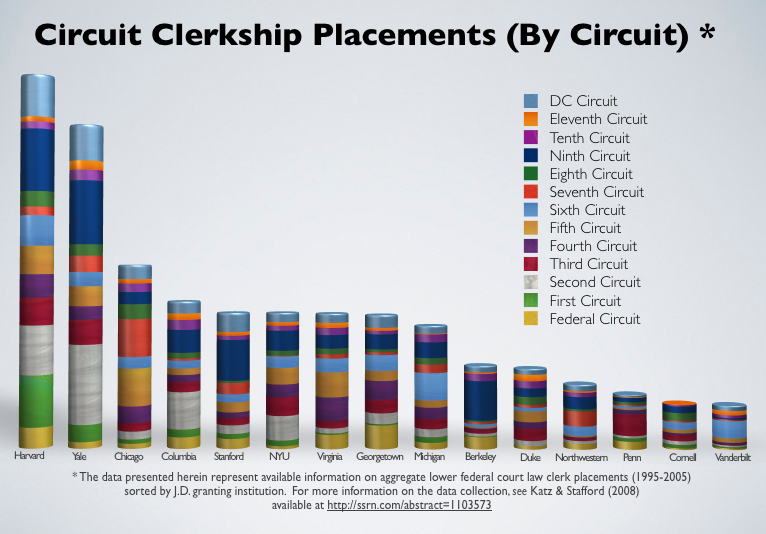
Highlighting underlying data Derek Stafford and I collected for our article Hustle and Flow: A Social Network Analysis of the American Federal Judiciary — here is some additional information on the law clerk tournament.  In the original post, we highlighted both Circuit and District Court Clerkship Placements for the 1995-2005 period.

Using only the Circuit Court data, we thought it might be interesting to consider how those placements are distributed across the various circuits.  At first glance, observe the regional or home turf bias contained in the placements (Penn 3rd Circuit ; Vanderbilt 6th Circuit).  Furthermore, consider institutions whose placements are highly concentrated (Berkeley 9th Circuit) versus institutions with more diffuse placements (Michigan, Chicago).  

The Revolution Will Not Be Televised — But Will it Come from HLS or YLS ? A Social Network Analysis of the Legal Academy (Part IV)

Law Prof Diffusion

This is the final installment of posts related to Reproduction of Hierarchy? A Social Network Analysis of the American Law Professoriate. Thanks for your emails.

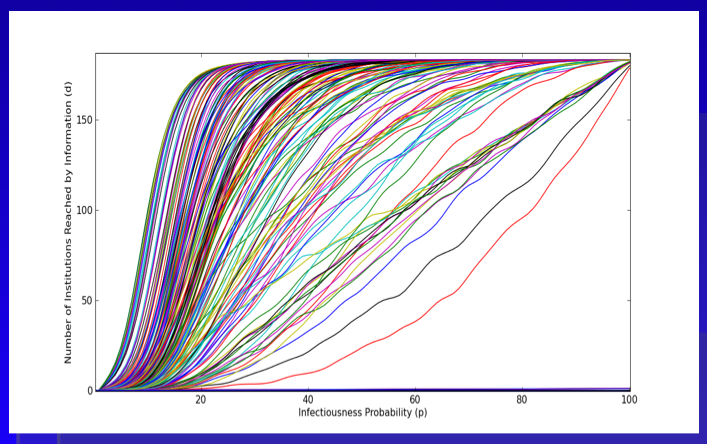
Here is the plot we provide within the paper.  As a general proposition, we believe this represents an upper bound measure for the intellectual reach of an agenda offered by a given institution.  With respect to our version of the Reed Frost Epidemiological Model, we use the p parameter to model “idea infectiousness.”  When p = 1 every institution “contacted” by the idea is infected with the idea. When p = 0 no institution “contacted” by the idea is infected.  In this version, we use the programming language python to run the model 500 times per institution. The above plot represents an estimate of the “diffusion curve” for each of the 184 institutions in our model. Building off central limit type properties, this leaves a far better estimate of reach than is offered in the single model run from the previous Netlogo GUI.

A cursory review of the above plot demonstrates, we are far from the land of linearity.  Namely, a large number of institutions are able to reach much of the graph with very small changes in the value of p.

In the Structure of Scientific Revolutions, Kuhn quotes from Max Planck:  “a new scientific truth does not triumph by convincing its opponents and making them see the light, but rather because its opponents eventually die, and a new generation grows up that is familiar with it.” Following Planck, we believe retirement is indeed be an important mechanism.  However, we also argue the nature of the p parameter is a relevant consideration.  In fact, unpacking various dimensions of p is the key to the broader model. Specifically, what are the properties of an idea that generate its infectiousness? Of course, we might like to believe infectiousness is related to a class of normatively attractive properties such as promoting efficiency or justice.  However, it is not clear that this follows.

We took no pass on the question of whether some institutions would be better or worse at producing ideas with greater or lesser values of p. The motivated question for this post considers whether, in general, the institutions which are top producers of law professors are (1) leaders in innovation, (2) subsequent ratifiers of a newly established paradigm or (3) defenders of the status quo. In a deep sense, we are asking how to reasonably model decision making by the heterogeneous agents located at such institutions.  Do institutions reward or punish intellectual risk-taking, search, etc.?

While this is an empirical question beyond the scope of this post, it worth asking because it partially informs the micro-dynamics plausibly responsible for generating the spread of new intellectual paradigms.

Model of Intellectual Diffusion Upon the American Legal Academy


picture-211
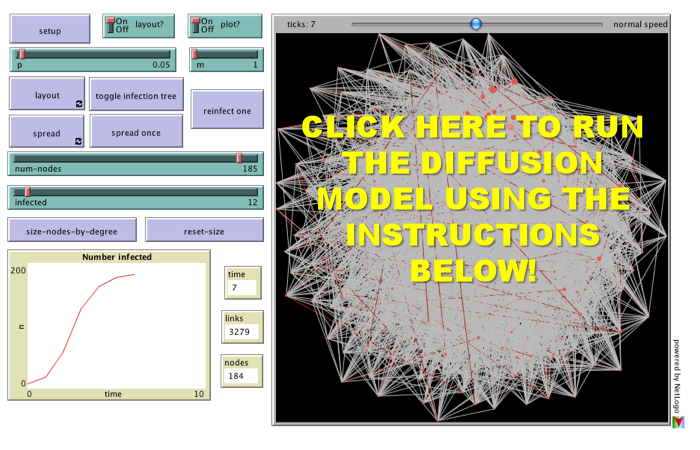
For the third installment of posts related to Reproduction of Hierarchy? A Social Network Analysis of the American Law Professoriate, we offer a Netlogo simulation of intellectual diffusion on the network we previously visualized.  As noted in prior posts, we are interested legal socialization and its role in considering the spread of particular intellectual or doctrinal paradigms. This model captures a discrete run of the social epidemiological model we offer in the paper.   As we noted within the paper, this represents a first cut on the question—where we favor parsimony over complexity.  In the paper and in the model documentation, we offer some possible model extensions which could be considered in future scholarship.   

Once you click through to the model, here is how it works:

(1) Click the Setup Button in the Upper Left Corner.  This will Display the Network in the Circular Layout. 

(2) Click the Layout Button.  Depending upon the speed of your machine this may take up to 30 seconds.  Stop the Layout Button by Re-Clicking the Button. 

(3) Click the Size Nodes by Degree Button. You Will Notice the Fairly Central Node Colored in Red.  This is School #12 Northwestern University Law School.  Observe how we have set the default infected school as #12 Northwestern (Hat Tip to Uri Wilensky).  A Full List of School Number is available at the bottom of the page when you click through.     

(4) Now, we are ready to begin.  Click the Spread Once Button.  The idea then reaches its neighbors with probability p (set as a default at .05).  You can click the Toggle Infection Tree button (at any point) to observe the discrete paths traversed by the idea.  

(5) Click the Spread Once Button, again and again.  Notice the plot tracking the time on the x axis and the number of institution infected on the y axis.  This is an estimate of the diffusion curve for the institution.    

(6) To restart the simulation, click the Reinfect One button.  Prior to hitting this button, slide the Infected Slider to any Law School you would like to observe.  Also, feel free to adjust the p slider to increase or decrease the infectiousness of the idea. 

Please comment if you have any difficulty or questions.  Note you must have Java 1.4.1 + installed on your computer.  The Information Technology professionals at many institutions will have already installed this on your machine but if not you will need to download it.   We hope you enjoy! 

A Social Network Analysis of the American Law Professoriate (Part II)


Layered Visual


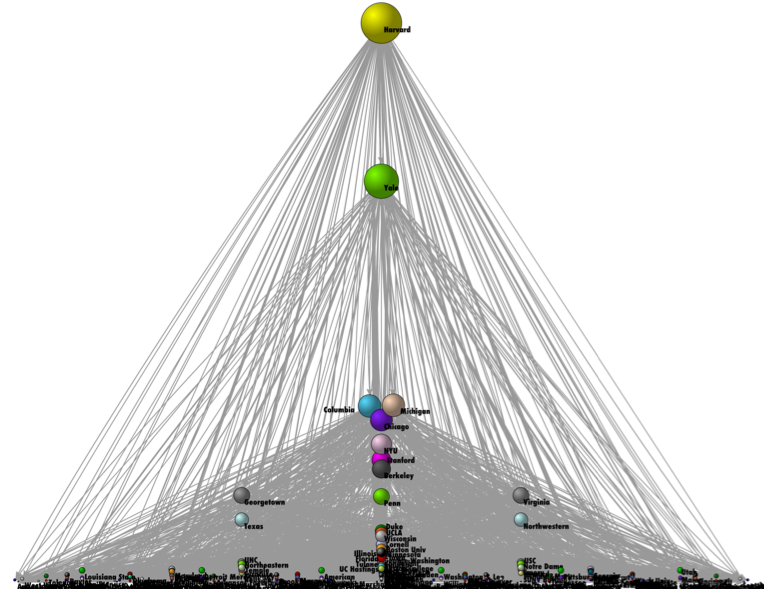
This is the second post related to our recently released paper Reproduction of Hierarchy? A Social Network Analysis of the American Law Professoriate.  We believe a hierarchical depiction of the network helps uncover latent distribution of authority present in the law professor network.  Specifically, between 10-15 law schools are responsible socializing a significant percentage of the future legal academics.   

Log-Log

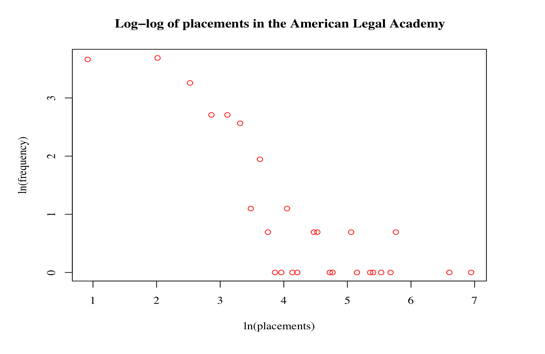
This extreme skewing of social authority presented in the visualization is also displayed in the above log-log of the degree distribution. While the -1.93 alpha level and size of the network falls outside the traditional power law/scale free range, the plot above does demonstrate the extreme skewing of social authority among institutions of legal education.  

This is the time of year when there is significant discussion of the US News Rankings.  We believe there is a wide-class of available data—data which could be characterized as the revealed preferences of important actors within the American legal system.  For example, we have previous offered information on how judges select clerks from law schools? Now, we offer some empirical insight into how hiring committees vote over various institutions? 

Coming later in the week, we will offer a Netlogo GUI which allows a user to start ideas at various institutions and observe how many generations they take to spread from institution to institution. There are significant caveats in the interpretation of our model but we think many people will still find it interesting. Please stay tuned and as always please tell your friends and colleagues about the CLS Blog!  

A Social Network Analysis of the American Law Professoriate (Part I)

picture-14

Last month, my colleagues and I posted Reproduction of Hierarchy? A Social Network Analysis of the American Law Professoriate to the SSRN.  We have been quite happy with the initial response to the article.  It has been posted on a number of blogs including ELS BlogTax Prof BlogLegal Theory BlogUS News and World Report Blog as well as several others. 

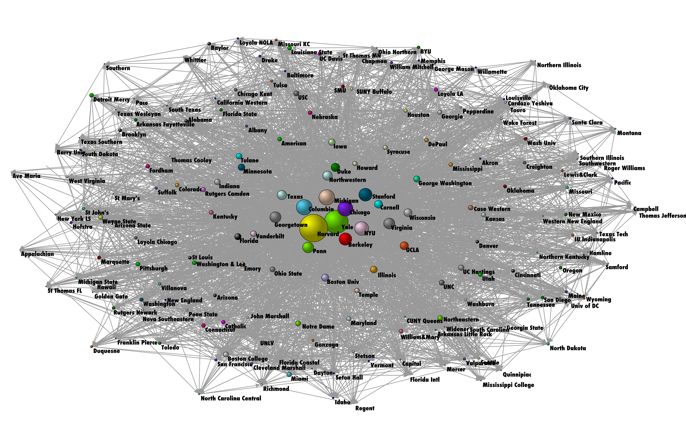
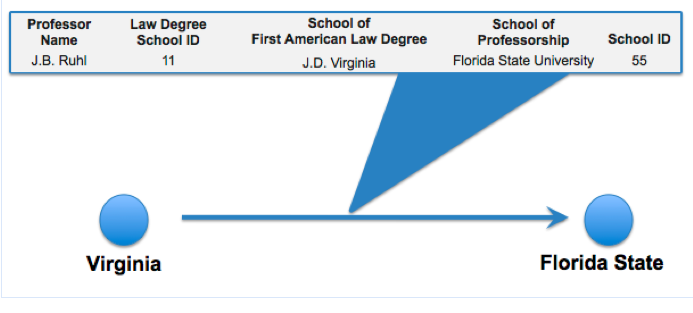
To develop the network, our paper uses an approach first developed in the network science literature by Fowler, Grofman & Masuoka. The network visualized above relies upon mapping the institution where an individual received their primary legal socialization to the institution where that individual acts to socialize the next generation. The example below demonstrates the move from our data set to the full graph of 184 Institutions and 7,200+ Professors.  In the full graph, the institutions are sized by the number of inbound connections.  Harvard Law School has the largest number of placements and is the largest node contained in the graph.

This is first of a multipart series of posts regarding the ideas contained in the paper.  In subsequent posts, I hope to comment on a variety of matters including how we use the above network to computationally model spread of intellectual and doctrinal paradigms. To preview, we use the above network architecture in a Reed-Frost style social epidemiological model. 

April as the Cruellest Month? Data on the Law Clerkship Tournament


picture-13


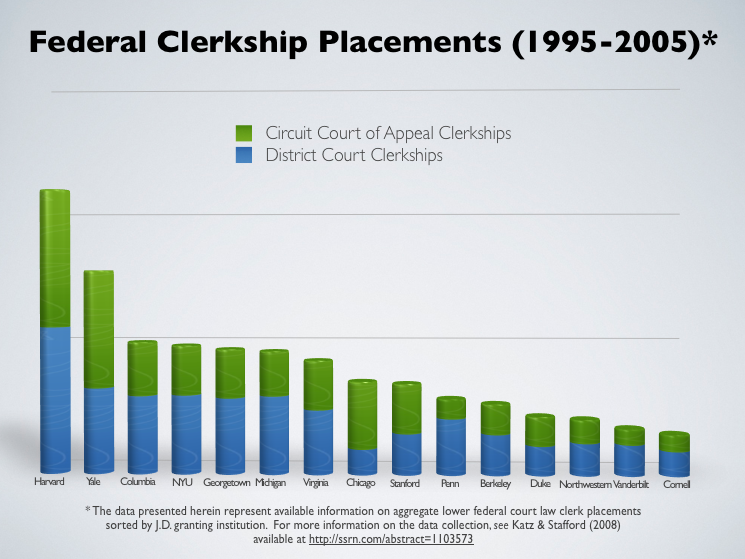
Judge Wald’s classic article describing the market for judicial clerks reminds us how April was once the cruellest month.  Given the Federal Law Clerk Hiring plan has shifted the relevant window of discomfort, we thought it reasonable to ring in the spring season with some of our data on the law clerk tournament.  Using underlying information Derek Stafford and I collected for our article Hustle and Flow: A Social Network Analysis of the American Federal Judiciary, here is Federal Court Clerkship data for the period of the “Natural” Rehnquist Court.  The current offering is aimed at the US News Top 15 Law Schools.  Although this data terminates in the 2004- 2005 clerkship year, we still believe it offers useful empirical insight into the status of the law clerk tournament.