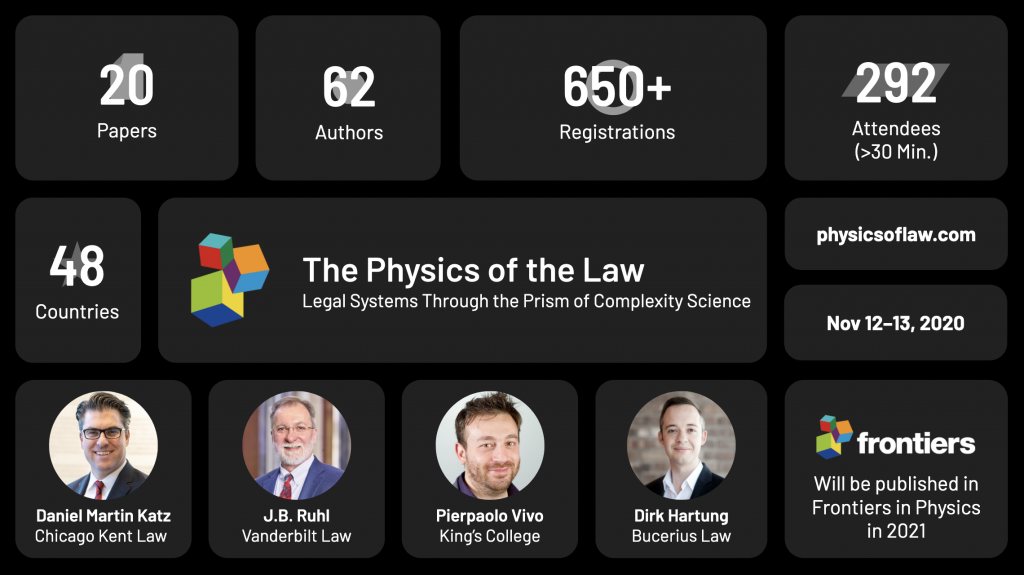
Thanks to everyone who attended The Physics of Law Virtual Conference earlier this month. Overall, we had 292+ Attendees from 48 Countries watch the presentation of 20 Academic Papers by 62 Authors. We saw a wide range of methods from Physics, Computer Science and Applied Mathematics devoted to the exploration of legal systems and their outputs.
Methodological approaches included Agent Based Modeling, Game Theory and other Formal Modeling, Dynamics of Acyclic Digraphs, Knowledge Graphs, Entropy of Legal Systems, Temporal Modeling of MultiGraphs, Information Diffusion, etc.
NLP Methods on display included traditional approaches such as TF-IDF, n-grams, entity identification and other metadata extraction as well as more advanced methods such as Bert, Word2Vec, GloVe, etc.
Methods were then applied to topics including Attorney Advocacy Networks, Statutory Outputs from Legislatures, various bodies of Regulations, Contracts, Patents, Shell Corporations, Common Law Systems, Legal Scholarship and Legal Rules ∩ Financial Systems.
If you have an eligible paper – it is not too late to submit – papers are due in January. After undergoing the Peer Review process — Look for the Final Papers to be published in Frontiers in Physics in 2021.
Over the next two days, we will have 20 Papers Presented from Scholars from Around the World …Click here to access the site so you can Sign Up for Day 2. If you would like to access the full agenda click here.
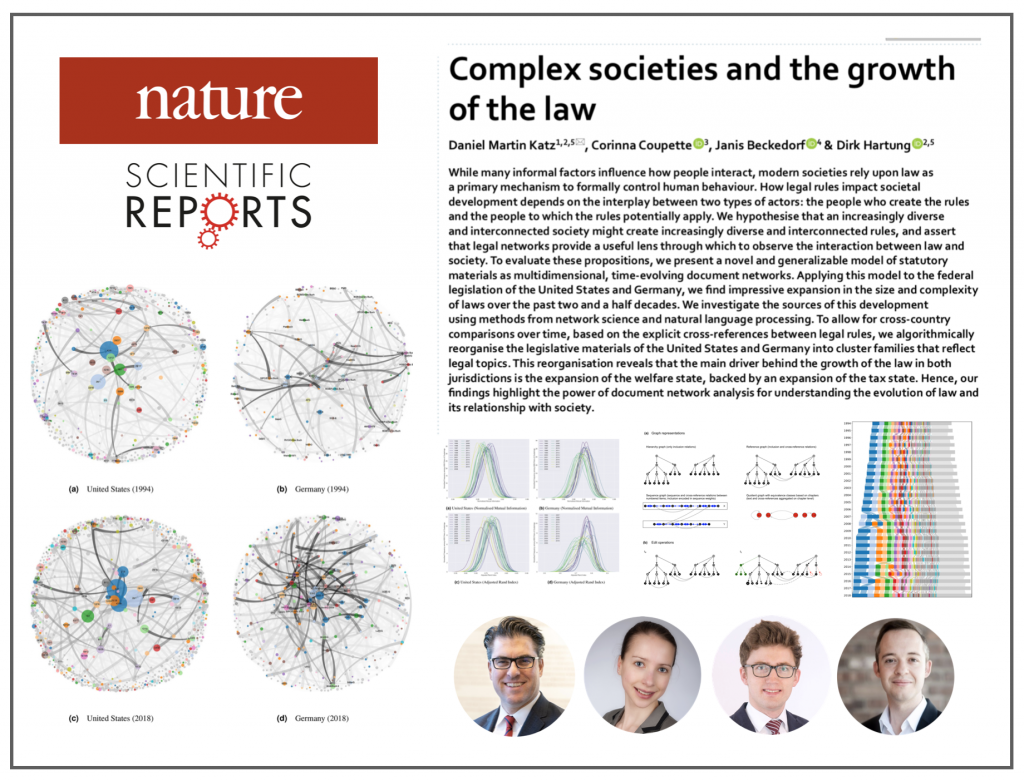
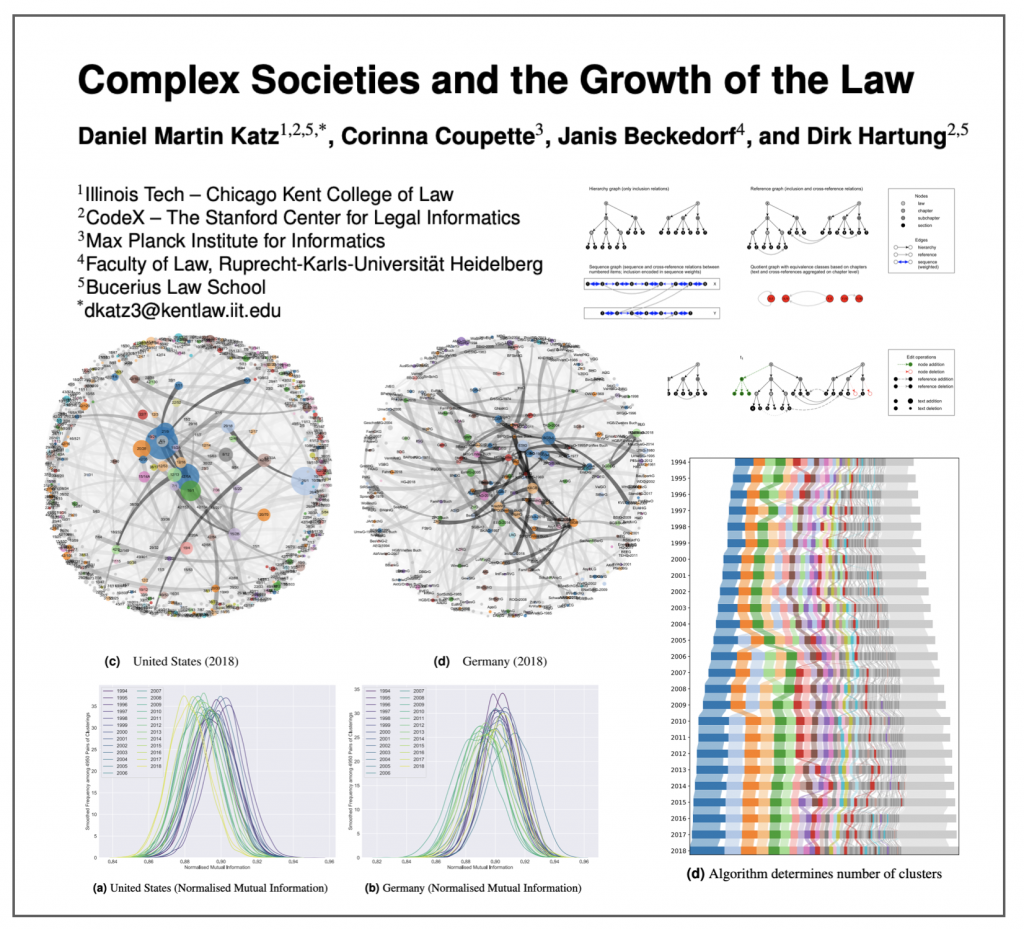
ABSTRACT: While many informal factors influence how people interact, modern societies rely upon law as a primary mechanism to formally control human behaviour. How legal rules impact societal development depends on the interplay between two types of actors: the people who create the rules and the people to which the rules potentially apply. We hypothesise that an increasingly diverse and interconnected society might create increasingly diverse and interconnected rules, and assert that legal networks provide a useful lens through which to observe the interaction between law and society. To evaluate these propositions, we present a novel and generalizable model of statutory materials as multidimensional, time-evolving document networks. Applying this model to the federal legislation of the United States and Germany, we find impressive expansion in the size and complexity of laws over the past two and a half decades. We investigate the sources of this development using methods from network science and natural language processing. To allow for cross-country comparisons over time, based on the explicit cross-references between legal rules, we algorithmically reorganise the legislative materials of the United States and Germany into cluster families that reflect legal topics. This reorganisation reveals that the main driver behind the growth of the law in both jurisdictions is the expansion of the welfare state, backed by an expansion of the tax state. Hence, our findings highlight the power of document network analysis for understanding the evolution of law and its relationship with society.
It has been a real pleasure to work with my transatlantic colleagues Corinna Coupette (Max Planck Institute for Informatics), Janis Beckedorf (Heidelberg University) and Dirk Hartung (Bucerius Law School). We have other projects also in the works — so stay tuned!
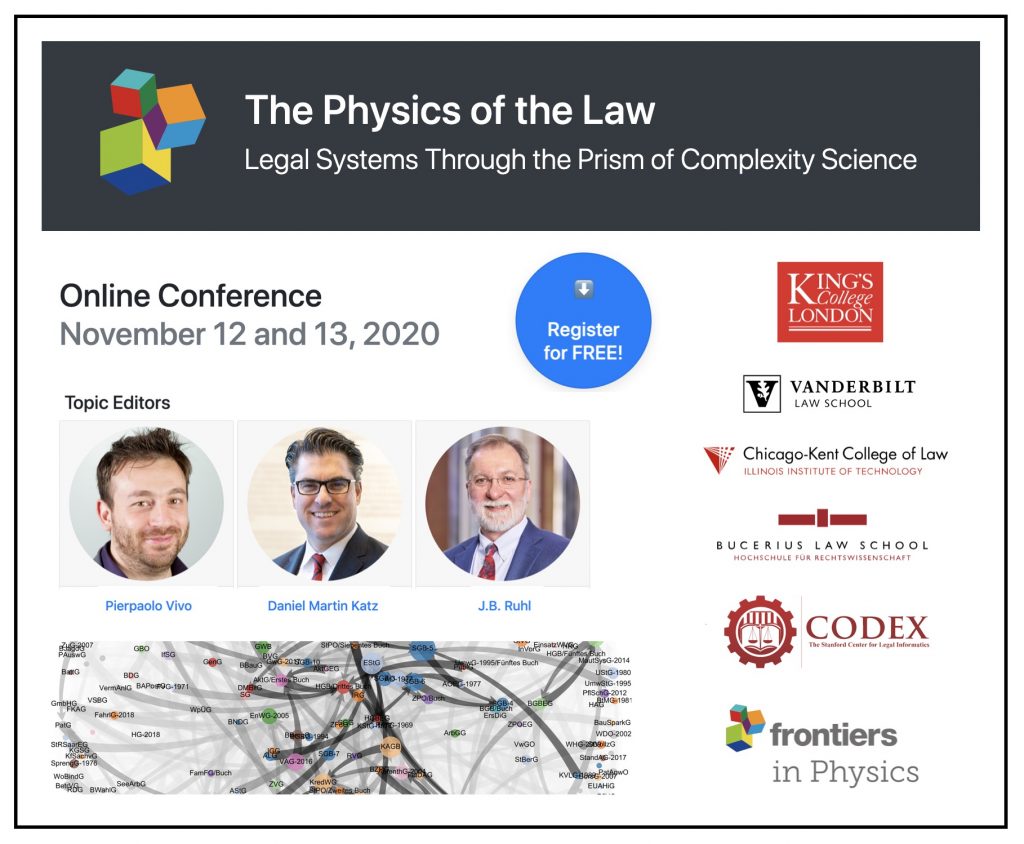
Here is the PDF of DRAFT Agenda for our Online Academic Conference entitled “The Physics of Law” which will take place on November 12-13. We have 20 Accepted Paper Abstracts from Research Teams from Around the World. Access to the Conference is FREE – but Registration is Required. Sign Up Today at PhysicsOfLaw.com !
Papers presented at this Conference are part of a Special Track for Frontiers in Physics and will appear in 2021 (after undergoing the Peer Review Process). Note although this is a technical conference — papers will reflect a range of methodological approaches (i.e. may be either Theoretical or Empirical).
Papers presented at this Conference are part of a Special Track for Frontiers in Physics and will appear in 2021 (after undergoing the Peer Review Process).
After our Call for Papers — we have 20 Accepted Paper Abstracts for Papers which will presented at the Online Conference on November 12-13, 2020.
Note although this is a technical conference — papers will reflect a range of methodological approaches (i.e. may be either Theoretical or Empirical).
Access to the Conference is FREE – but Registration is Required. Sign Up Today at PhysicsOfLaw.com
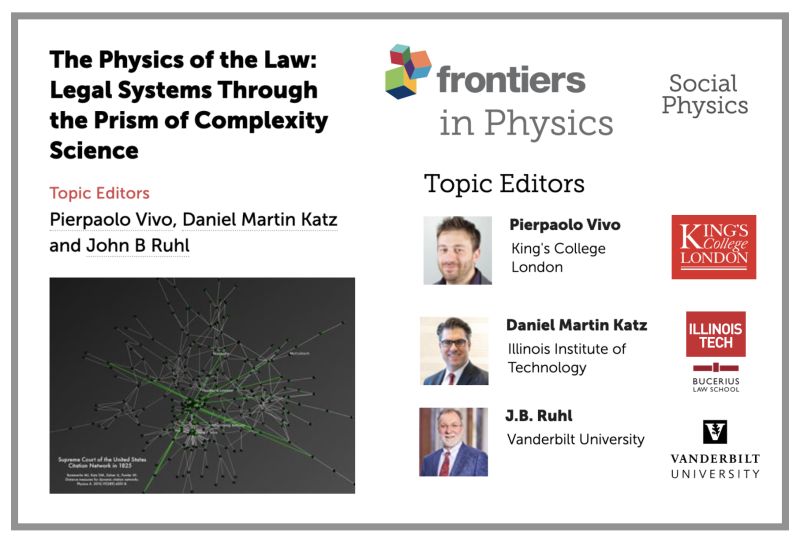
Open Call for Papers for a Special Collection in FRONTIERS in PHYSICS — “The Physics of the Law: Legal Systems Through the Prism of Complexity Science.” So far we have more than 30+ Scholars who have accepted our call for papers but we welcome others who would like to participate. Abstracts are due September 14th.
We welcome Original Research and Reviews where complexity science and quantitative approaches are deployed to evaluate the law / legal systems. Papers will be Peer Reviewed under the standards of Frontiers in Physics (or allied Frontiers Journals).
Papers can be empirical or theoretical but should be technical. If you have any questions feel free to message me.
An Online Virtual Conference will be held in early November.
Updated Version of our Paper — ’Complex Societies and the Growth of the Law’ is now on SSRN / arXiv. It is primarily a methods and measurement paper combining Network Science, Natural Language Processing, etc. to evaluate the growth of the law as a function of time. #LegalComplexity #LegalScience #NLP #NetworkScience #ComplexSystems #DataScience
ABSTRACT – While a large number of informal factors influence how people interact, modern societies rely upon law as a primary mechanism to formally control human behaviour. How legal rules impact societal development depends on the interplay between two types of actors: the people who create the rules and the people to which the rules potentially apply. We hypothesise that an increasingly diverse and interconnected society might create increasingly diverse and interconnected rules, and assert that legal networks provide a useful lens through which to observe the interaction between law and society. To evaluate these propositions, we present a novel and generalizable model of statutory materials as multidimensional, time-evolving document networks. Applying this model to the federal legislation of the United States and Germany, we find impressive expansion in the size and complexity of laws over the past two and a half decades. We investigate the sources of this development using methods from network science and natural language processing. To allow for cross-country comparisons over time, we algorithmically reorganise the legislative materials of the United States and Germany into cluster families that reflect legal topics. This reorganisation reveals that the main driver behind the growth of the law in both jurisdictions is the expansion of the welfare state, backed by an expansion of the tax state.
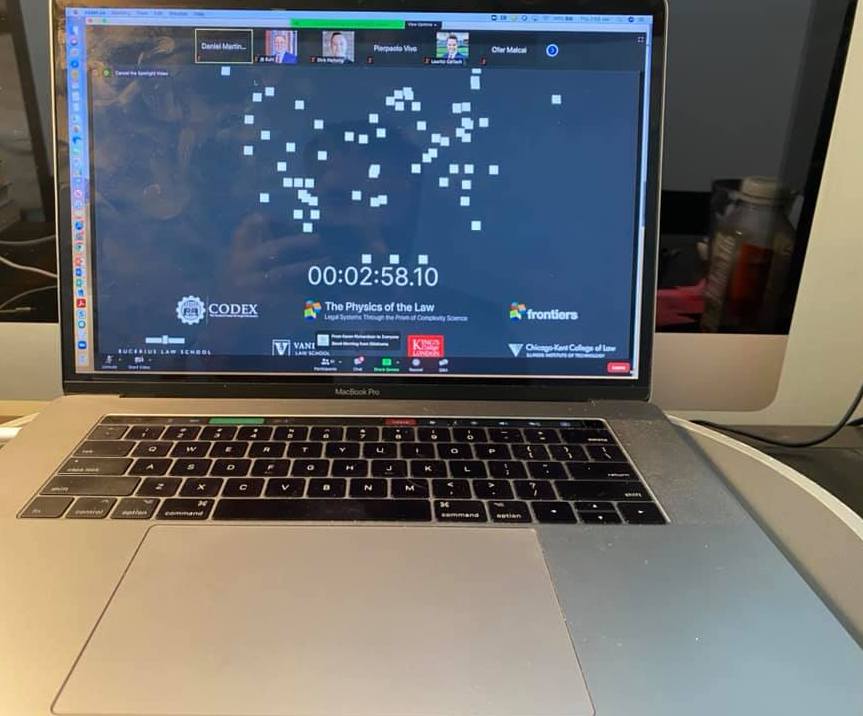
Click on this icon to view the Movie in Full Screen Mode!
STATIC SNAPSHOT TO DYNAMIC ANIMATION
In our prior post analyzing the email database of Climate Research Unitat the University of East Anglia, we aggregated all emails over the relevant 1997-2009 time period into a single static visualization. Specifically, to build the network, we processed every email in the leaked data. Each email contains a sender and at least one recipient on the To:, Cc:, or Bcc: line.
One obvious shortcoming associated with producing a static snapshot for data set, is that it often obscures the time evolving dynamics of interaction which produced the full graph. To generate a dynamic picture, it is necessary to collect time stamped network data. In the current case, this required acquisition of the date field for each of the emails. With this information, we used the same underlying data to generate a dynamic network animation for the 1997-2009 time window.
HOW TO INTERPET THE MOVIE
Consistent with the approach offered in our prior visualization, each node represents an individual within the email dataset while each connection reflects the weighted relationship between those individuals. The movie posted above features the date in the upper left. As time ticks forward, you will notice that the relative social relationships between individuals are updated with each new batch of emails. In some periods, this updating has significant impact upon the broader network topology and at other time it imposes little structural consequences.
In each period, both new connections as well as new communications across existing connections are colored teal while the existing and dormant relationships remain white. Among other things, this is useful because it identifies when a connection is established and which interactions are active at any given time period.
A SHORT VERSION AND A LONG VERSION
We have two separate versions of the movie. The version above is a shorter version where roughly 13 years is displayed in under 2 minutes. In the coming days, we will have a longer version of the movie which ticks a one email at a time. In both versions, each frame is rendered using the Kamada-Kawailayout algorithm. Then, the frames are threaded together using linear interpolation.
SELECTION EFFECTS
Issues of selection of confront many researchers. Namely, given the released emails are only a subset of the broader universe of emails authored over the relevant time window, it is important to remember that the data has been filtered and the impact of this filtration can not be precisely determined. Notwithstanding this issue, our assumption is that every email from a sender to a recipient represents a some level of relationship between them. Furthermore, we assume that more emails sent between two people generally indicates a stronger relationship between those individuals.
DIMENSIONALITY
In our academic scholarship, we have confronted questions of dimensionality in network data. Simply put, analyzing network data drawn from high dimensional space can be really thorny. In the current context, a given email box likely contains emails on lots of subjects and reflects lots of people not relevant to the specific issue in question. Again, while we do not specifically know the manner in which the filter was applied, it is certainly possible that the filter actually served to mitigate issues of dimensionality.
When it comes to quickly motivating a point or engaging students in a classroom, one of the most effective tools is visualization. Not only do movies provide fun and excitement, but they also allow viewers to leverage the abilities of the visual cortex to infer dynamics and patterns in the animated system.
For our recent research, dynamic graphs are the type of system of interest. As I’ve covered before, Python is my language of choice for most programming tasks. Furthermore, Python is a very accessible language, even for beginners. However, when it comes to visualizing dynamic networks, we need another tool. Our tool of choice is SONIA, the Social Network Image Animator.
I thought I’d provide a helpful little function to generate SONIA input files from igraph objects, along with a few examples.
This function takes as input an igraph.Graph object and a file name to store the SONIA output in. Every vertex in the Graph object should have a time attributed specified, either simply as an integer indicating the start time, or as a tuple or list of the form (startTime,endTime). Check out the following two examples if you need more guidance. Both examples visualize the construction of a periodic lattice. However, in the second example, nodes decay after some random time. Make sure not to miss the second video at the bottom of the post!