United States Court of Appeals & Parallel Tag Clouds from IBM Research [Repost from 10/23]

Download the paper: Collins, Christopher; Viégas, Fernanda B.; Wattenberg, Martin. Parallel Tag Clouds to Explore Faceted Text Corpora To appear in Proceedings of the IEEE Symposium on Visual Analytics Science and Technology (VAST), October, 2009. [Note: The Paper is 24.5 MB]

Here is the abstract: Do court cases differ from place to place? What kind of picture do we get by looking at a country’s collection of law cases? We introduce Parallel Tag Clouds: a new way to visualize differences amongst facets of very large metadata-rich text corpora. We have pointed Parallel Tag Clouds at a collection of over 600,000 US Circuit Court decisions spanning a period of 50 years and have discovered regional as well as linguistic differences between courts. The visualization technique combines graphical elements from parallel coordinates and traditional tag clouds to provide rich overviews of a document collection while acting as an entry point for exploration of individual texts. We augment basic parallel tag clouds with a details-in-context display and an option to visualize changes over a second facet of the data, such as time. We also address text mining challenges such as selecting the best words to visualize, and how to do so in reasonable time periods to maintain interactivity.

The Age of Quantum Computing? [From Nature]

From the Abstract … “The race is on to build a computer that exploits quantum mechanics. Such a machine could solve problems in physics, mathematics and cryptography that were once thought intractable, revolutionizing information technology and illuminating the foundations of physics. But when?” (Subscription may be required for Access)

The Structure and Complexity of the United States Code

Mike and I have been working on a paper we hope to soon post to the SSRN entitled ” The Structure and Complexity of the United States Code.”  Yesterday, we presented a pre-alpha version of the paper in the Michigan Center for Political Studies Workshop For those who might be interested, the abstract for the working abstract for the paper is below. If you are interested in accessing documentation for the above visualization please click here.

“The United States Code is the substantively important body of information that collectively constitutes the federal statutory law of the United States.  The Code is a complied hierarchical document organized into fifty substantive titles including Bankruptcy (Title 11), Judiciary and Judicial Procedure (Title 28), Public Health, and Welfare (Title 42) and Tax (Title 26).  In addition to its hierarchical organization, the Code contains an extensive citation network where cross-references connect its provisions in a variety of novel manners.

Claims regarding complexity of the Code, in particular the Internal Revenue Code, are consistently part of the public discourse. Undoubtedly, the Code is complicated. However, quantifying its complexity is a far more difficult proposition.  While there have been some initial attempts to identify the size of certain pieces of the Code, few comprehensive or comparative investigations of the entire United States Code have been undertaken.

In this article, we ask how complex is the United States Code and in comparative terms which titles are the most and least complex? Employing a wide variety of approaches including techniques drawn from information theory, computer science, linguistics and applied graph theory, we develop and apply a series of distinct measures for the structural and linguistic complexity of the Code.  After developing these discrete approaches, we generate a composite measure and use it to comparatively score each of the Code’s titles. While we recognize other composite measures for size and complexity could legitimately be offered, we believe our interdisciplinary approach represents a significant advance and provides much needed rigor to questions of code complexity.”

The State of the Union and Computational Models of Standing Ovations

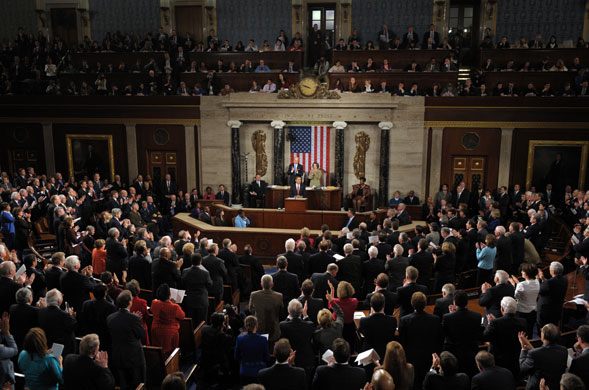
The State of the Union often provides for dramatic political theatre. While watching President Obama’s first State of the Union Address last night, I could not help but think about a particular subplot associated with the speech–the Republican caucus and the “standing ovation problem.” With respect to being the party not currently occupying the White House–from the individual member all the way up to the full caucus–it is difficult for the individual member to determine (1) whether to applaud (2) if a given statement by the President is worthy of a standing ovation. From my passive consumption of the television coverage, there was clearly significant variation in the number of Republican caucus members standing at any given applause moment.

For those not familiar, here is a State of the Union based description of the standing ovation problem. “The standing ovation model illustrates a familiar decision-making problem: after hearing a given statement by the President a subset of the audience begins to applaud. The applause builds and a few members of the respective caucus may decide to stand up in enthusiastic recognition. In this situation every other member of the respective caucus must decide whether to join the standing individuals in their ovation, or else remain seated. It is not a trivial decision; imagine, for example, that you initially decide to stay down quietly but then find yourself surrounded by people standing and clapping vigorously. It seems plausible that you may feel awkward, change your mind and end up standing up, saving yourself a significant dose of potential embarrassment. Analogously, you probably wouldn’t enjoy being the only person standing and clapping alone in the middle of a crowded chamber of seated people.”

While often considered along with other related information cascade problems, generating agent based models for the so called “standing ovation problem” has been the focus of a number of scholars.  For example, along with John Miller (Carnegie Mellon), Michigan CSCS Director Scott E. Page has authored a leading article on the “standing ovation problem.”  Using an agent based modeling approach, Miller & Page analyze a variety dynamics associated with this rich problem. For those interested, here is a link to a standing ovation ABM in Netlogo (requires Java).

Slides from our Presentation at UPenn Computational Linguistics (CLUNCH) / Linguistic Data Consortium (LDC)

We have spent the past couple days at the University of Pennsylvania where we presented information about our efforts to compile a complete United States Supreme Court Corpus.  As noted in the slides below, we are interested in creating a corpus containing not only every SCOTUS opinion, but also every SCOTUS disposition from 1791-2010. Slight variants of the slides below were presented at the Penn Computational Linguistics Lunch (CLunch) and the Linguistic Data Consortium(LDC).  We really appreciated the feedback and are looking forward to continue our work with the LDC.  For those who might be interested, take a look at the slides embedded below or click on this link:

Large Scale ( 130,000 + ) Zoomable Visualization of a Twitter Network

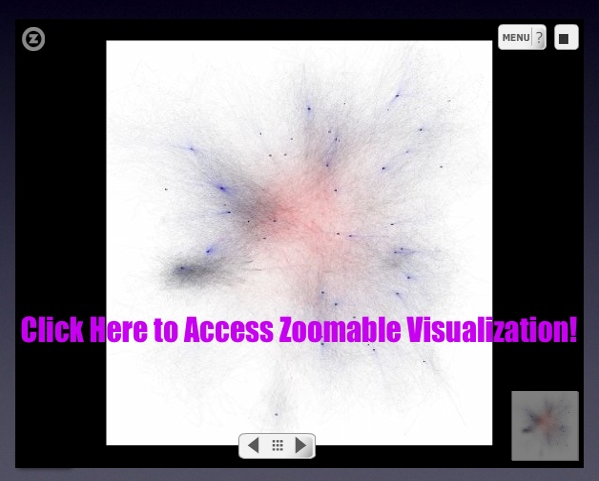
Starting with the Michael Bommarito’s twitter handle mjbommar, we built this visualization by collecting Mike’s direct friends, friends-friends, friends-friends-friends, etc. until we decided to stop …. just after passing 130,000 total twitter handles.  Using the Fruchterman-Rheingold algorithm, we visualized a network where |V| = 130365, |E| = 197399.

Those interested in reviewing some other twitter visualizations, please consult Nathan Yau at Flowing Data who has collected some of his favorites.  To our knowledge, the visualization we offer above is one the larger visualizations of twitter that have been produced to date. When you zoom in, you will notice we have flagged some of the celebrity twitter users we detected in the mjbommar friends-friends-friends, etc. network.  For example, as shown above Ashton Kutcher (aplusk), Chad Ochocinco (OGOchOCinco) and RainnWilson (rainnwilson) are contained therein.

Given the budget limitations of this blog, we cannot host this visualization in house. However, if you click the picture above, you can access the visual from Seadragon … a zoomable visualization platform from Microsoft Labs.

The Senate Campaign Contribution Network: A Visualization Repost in Light of the Court’s Decision in Citizens United v. Federal Election Commission

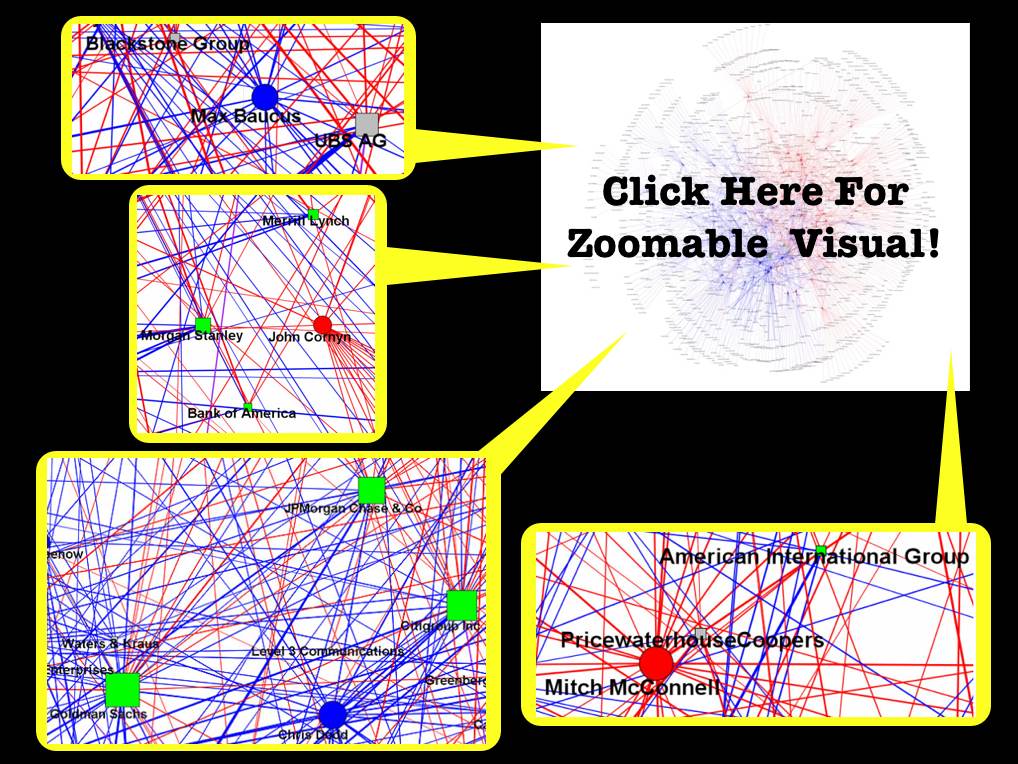
Today’s decision in Citizens United v. Federal Election Commission has justifiably generated a significant amount of media / blogosphere coverage. For those not familiar with the Court’s decision, there is a full roundup of analysis available at SCOTUS Blog and Election Law Blog. In light of today’s decision we decided to repost highlights of our visualization of the campaign contribution network for the Senators of the 110th Congress. For those interested, the original post is offered here and the documentation is here. Also, there are variety of other related posts related to the 110th Congress available under this tag.  Suffice to say, in light of today’s decision, there is likely to be some significant changes to the contribution network of the 111th Congress (Second Session) ….

GraphMovie: A Library for Generating Movies from Dynamic Graphs with igraph

Over the past few months, we’ve developed a library for simply generating dynamic network animations. We’ve used this library in visualizations like (1) Visualizing the Gawaher Interactions of Umar Farouk Abdulmutallab, the Christmas Day Bomber and (2) Dynamic Animation of the East Anglia Climate Research Unit Email Network.  Prior to these visualizations, we’ve used Sonia to produce animations like this one. While certainly a useful program for those without programming expertise, Sonia suffers from a number of issues that make it unusable for large graphs or graphs with many “slices.”  Furthermore, in our experience rendering various movies a number of platform issues with the Quicktime and Flash rendering engines have arisen.  Fixing these problems is possible, but Sonia’s large Java codebase makes for a steep learning curve.  As a result, we’ve decided to release this GraphMovie class so that others can use or possibly improve this library.

In order to use the GraphMovie, you’ll need the following:

  • python (tested with 2.6)
  • igraph for network manipulation and visualization
  • Python Imaging Library for manipulating the image frames
  • mencoder from the MPlayer package for encoding the image frames into a movie

Here are the files, hosted on github:

GraphMovie: Example 1 from Computational Legal Studies on Vimeo.

GraphMovie: Example 2 from Computational Legal Studies on Vimeo.

Netflix Challenge for SCOTUS Prediction?

During our break from blogging, Ian Ayers offered a very interesting post over a Freakonomics entitled “Prediction Markets vs. Super Crunching: Which Can Better Predict How Justice Kennedy Will Vote?” In general terms, the post compares the well known statistical model offered by Martin-Quinn to the new Supreme Court Fantasy League created by Josh Blackman. We were particularly interested in a sentence located at end of the post … “[T]he fantasy league predictions would probably be more accurate if market participants had to actually put their money behind their predictions (as with intrade.com).”  This point is well taken. Extending the idea of having some “skin in the game,” we wondered what sort of intellectual returns could be generated for the field of quantitative Supreme Court prediction by some sort of Netflix style SCOTUS challenge.

The Martin-Quinn model has significantly advanced the field of quantitative analysis of the United States Supreme Court. However, despite all of the benefits the model has offered, it is unlikely to be the last word on the question. While only time will tell, an improved prediction algorithm might very well be generated through the application of ideas in machine learning and via incorporation of additional components such as text, citations, etc.

With significant financial sum at stake … even far less than the real Netflix challenge … it is certainly possible that a non-trivial mprovement could be generated. In a discussion among a few of us here at the Michigan CSCS lab, we generated the following non-exhaustive set of possible ground rules for a Netflix Style SCOTUS challenge:

  1. To be unseated, the winning team should be required to make a non-trivial improvement upon the out-of-sample historical success of the Martin-Quinn Model.
  2. To prevent overfitting, the authors of this non-trivial improvement should be required to best the existing model for some prospective period.
  3. All of those who submit agree to publish their code in a standard programming language (C, Java, Python, etc.) with reasonable commenting / documentation.