To view the full image, please click here.
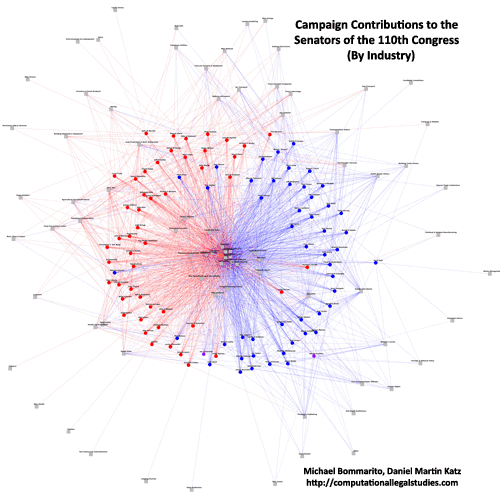
This represents a deeper cut on campaign contributions to the Senators of 110th Congress. Again, we rely upon data from the Center for Responsive Politics. The CRP aggregates contribution data up to the industry or economic sector. Thus, as before, we adopt their classification scheme and methodology herein. While aggregating to the industry/sector level removes the degree of specificity we offered in our earlier post, it provides a cleaner representation for the graph. For those interested in the other chamber, click here for the House of Representatives.
Click on the picture above and it will take you to our flash where you can zoom in and read the labels.
As you review the graph, please consider the following:
(1) Industries locate in the center of the graph because they provide significant funding to both Democrats and Republicans.
(2) Industries which generally only fund one political party are located toward the respective red/blue boundary. For example, it is hardly surprising to observe the location of “Oil and Gas” relative to “Environmental” groups.
(3) It is important to note that we do not impose the partisan separation or the placement of party outliers apparent in the image. Rather, the algorithm places Red Senators in Blue Territory and Blue Senators in Red Territory because they receive significant sums from industries who typically fund the opposing party. For example, consider Senator Olympia J Snowe (R-ME) who is typically characterized as a moderate Republican. Since she receives money from more industries that typically fund Democrats than Republicans, she is placed in Blue Territory by the algorithm.
(4) It is important not to over read the position of Senator Herb Kohl (D-WI). Over the relevant time window, Senator Kohl received 94% of his resources through self-financing.


4 thoughts on “Senators of the 110th Congress Take 2-Contributions by Industry/Sector”