Tag: congress
Iowa Electronic Markets: Who Will Win Control of the House in the 2010 Midterms?
For many years, the Iowa Electronic Markets have served as a futures market for political and economic information. As we move to the fall, the race for control of the House (and in turn the Speakership) appears to hang in the balance. The plot above offers both the current spot price as well as historic information regarding the markets’ perspective on this important race. Click here for information regarding this specific market.
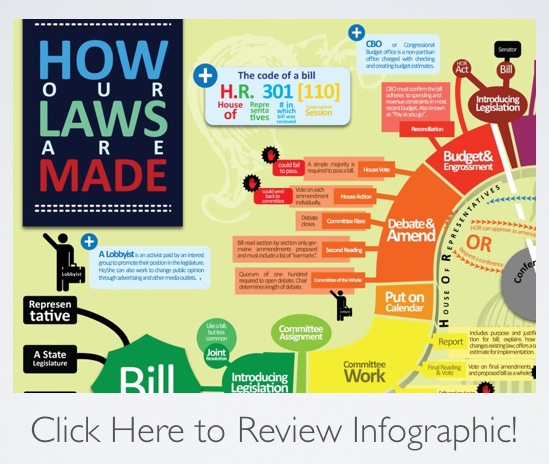
How a Bill Becomes a Law [Via Mike Wirth]
Check out this nice infographic! [HT RC Richards @ Legal Informatics Blog]
Sen. Sheldon Whitehouse on the Senate Floor Discussing the Length of the Health Care Bill and Citing Harry Potter Number [Via Think Progress]
Full Story over at Think Progress. Our original post on the length of HR 3962 is here. The subsequent NY Times Article on the Length of HR 3962 is here. Enjoy!
Katz & Bommarito in the New York Times Discussing H.R. 3962
If you click through on the link above you will be directed to the New York Times Rx Blog. The full version of the article appears online while a shorter version appeared in today’s print edition. For those viewing the print edition, the story is located on page A20. This website is mentioned in both versions of the story!
Visualizing the Structure of H.R. 3962 — The Health Care Bill
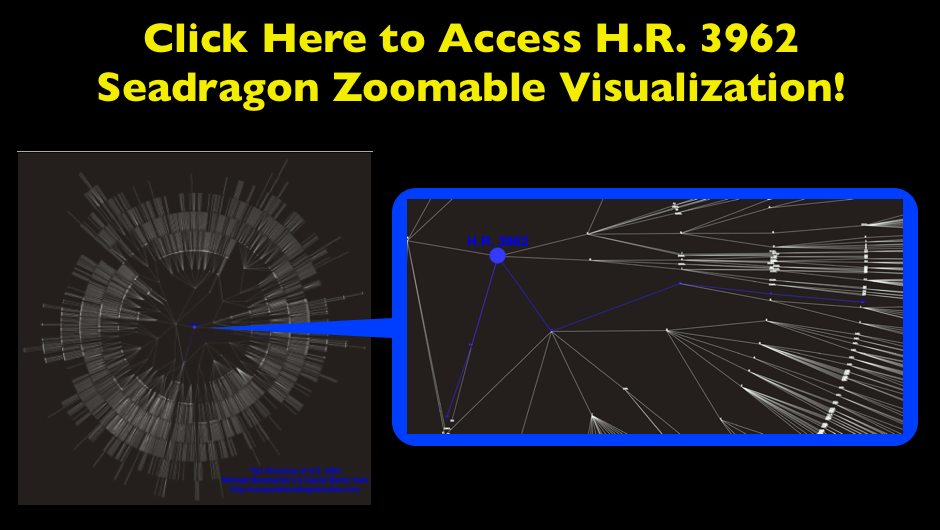
In addition to the facts we have presented on HR 3962, we wanted to offer a visualization for the structure of the Bill. Like many other bills, HR 3962, is divided into Divisions, Titles, Subtitles, Parts, Subparts, Sections, Subsections, Clauses, and Subclauses. These hierarchical splits represent the drafters’ conception of its organization, and thus the relative size of these categories may provide an indication of both the importance of each section of the Bill as well as the overall size of the document. By clicking through the image below, you can navigate a zoomable representation of the structure of HR 3962 using Microsoft’s Seadragon zoom interface. Many of the Divisions, Titles, Subtitles, Parts, and Subparts of the Bill are labeled. The balance are not labeled because they fell on an angle on the radial layout which rendered them impossible to read.
The graph is laid out in a radial manner with the center node labeled “H.R. 3962.” Legislation, the broader United States Code as well as many other classes of information are organized as hierarchical documents. H.R. 3962 is no different. For those less familiar with this type of documents, we thought it useful to provide a tutorial regarding (1) how to use this zoomable visualization (2) the correspondence between the visual and the Library of Congress version of H.R. 3962
How Do I Open/Navigate the Visualization?
(1) Open the Library of Congress version of H.R. 3962 in another browser window.
(2) Open the visualization by clicking on the large image above.
(3) Clicking on the image above will take you to the Seadragon platform. (Note: Load times will vary from machine to machine… so please be patient.)
(4) Seadragon allows for zoomable visualizations and for full screen viewing. Full screen is really the best way to go. If you run your mouse over the black box where the visual is located you will see four buttons in the southeast corner. The “full screen” button is the last one on the right. Click the button and you will be taken to full screen viewing!
(5) Click to zoom in and out, hold the mouse down and drag the entire visual, etc. Now, you are ready to traverse the graph using this visualization as your very own “H.R. 3962 Magic Decoder Wheel.”
How Do I Understand the Visualization?
To introduce the substance of the visualization, we have color coded two separate examples right into the visualization.
Example 1: Bills such as HR 3962 often feature a “short title” provision at the very begining of the legislation. For example, if you download the PDF copy of the bill, you can see the short title at the bottom of page 1 of the bill. You can also see this in the Library of Congress version of H.R. 3962.
SECTION 1. SHORT TITLE; TABLE OF DIVISIONS, TITLES, AND SUBTITLES.
(a) Short Title- This Act may be cited as the `Affordable Health Care for America Act’.
Zoom in close to start in the center where the large node labeled “HR 3962.” Notice the blue colorized path features the blue labels 1. and terminates with the label (a). The labels in the graph are the labels in the text above. While this is a simple example, the precise logic defines the entire graph.
Example 2: This is a bit more difficult as it requires the traversal of several provisions in order to reach a terminal node. In this case, the terminal node read as follows … “SEC. 401. INDIVIDUAL RESPONSIBILITY.For an individual’s responsibility to obtain acceptable coverage, see section 59B of the Internal Revenue Code of 1986 (as added by section 501 of this Act).”
DIVISION A–AFFORDABLE HEALTH CARE CHOICES
TITLE IV–SHARED RESPONSIBILITY
Subtitle A–Individual Responsibility
SEC. 401. INDIVIDUAL RESPONSIBILITY.
Again, zoom in close to start in the center--where the large node labeled “HR 3962.” Notice the blue colorized path features the blue labels A and terminates with the label 401. In between the start and finish, there are stops at IV and A, respectfully. Just as before, the labels in the graph are the labels in the text above. The end user can follow the precise journey but without the visual by using the Library of Congress version of H.R. 3962.
Facts About the Length of H.R. 3962, the Affordable Health Care for America Act (AHCAA)
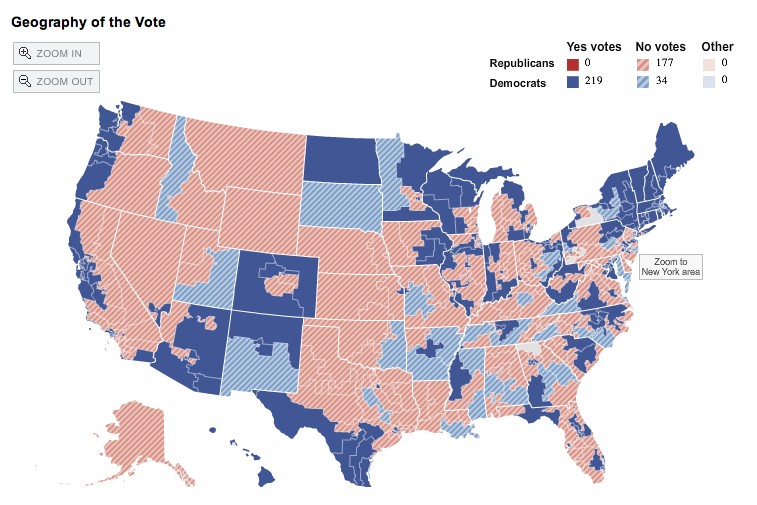
In light of last night’s vote on H.R. 3962, the Affordable Health Care for America Act, we decided to calculate a few numbers on the current bill. Based on the Library of Congress’s XML representation of the bill (which can be obtained here), we have calculated a number of linguistic and citation properties of the Bill. The House of Representative approved HR 3962 by a 220-215 margin. The New York Times features a useful analysis of the vote including a breakout by party and region here.
On the Sunday morning talk shows as well as in other outlets, there has been significant discussion regarding the size of H.R. 3962. Specifically, many critics have decried the length of the bill citing its 1990 pages. The bill is indeed 1990 pages as you can see if you choose to download a PDF copy of the bill.
The purpose of this post is to provide a perspective regarding the length of H.R. 3962. Those versed in the typesetting practices of the United States Congress know that the printed version of a bill contains a significant amount of whitespace including non-trivial space between lines, large headers and margins, an embedded table of contents, and large font. For example, consider page 12 of the printed version of H.R. 3962. This page contains fewer than 150 substantive words.
We believe a simple page count vastly overstates the actual length of bill. Rather than use page counts, we counted the number of words contained in the bill and compared these counts to the number of words in the existing United States Code. In addition, we consider the number of text blocks in the bill– where a text block is a unit of text under a section, subsection, clause, or sub-clause.
Basic Information about the Length of H.R. 3962
Number of words in H.R. 3962 impacting substantive law:
- 234,812 words (w/ generous calculation)
Number of total words in H.R. 3962: 363,086 words (w/ titles, tables of contents …)
Number of text blocks: 7,961
Average number of words per text block: 24.18
Average words per section: 267.03
Is this a Large or Small Number? Comparison to Harry Potter
Number of substantive words in H.R. 3962: 234,812 words
Harry Potter and the Order of the Phoenix – 257,000 words
Harry Potter and the Goblet of Fire – 190,000 words
Harry Potter and the Deathly Hallows – 198,000 words
Is this a Large or Small Number? Comparison to Other Legislation
Number of substantive words in Energy Bill of 2007: 157,835 words
Number of substantive words in Defense Authorization Act for 2010: 119,960 Words
H.R. 3962 is roughly 2x the Size of Medicare Rx Bill of 2003 (Given there is no public XML version of the bill, the Exact “Substantive Words” Number is not available)
Is this a Large or Small Number? Comparison to the Full U.S. Code
Size of the United States Code: 42+ Million Words
Relative Size of H.R. 3962: H.R. 3962 is roughly 1/2 of one percent of the size of the United States Code
Longest Sections in H.R. 3962
- Sec 341. Availability Through Health Insurance Exchange
- Sec 1222. Demonstration to promote access for Medicare beneficiaries with limited English proficiency by providing reimbursement for culturally and linguistically appropriate services.
- Sec 1160: Implementation, and Congressional review, of proposal to revise Medicare payments to promote high value health care
- Sec 305: Funding for the construction, expansion, and modernization of small ambulatory care facilities
- Sec 1417: Nationwide program for national and State background checks on direct patient access employees of long-term care facilities and providers
Modifications of the Existing U.S. Code By H.R. 3962
Number of Strikeouts: 332
Number of Inserts: 390
Number of Re-designations: 65
Acts Most Cited By H.R. 3962
Social Security Act: 622 times
Public Health Service Act: 134 times
Affordable Health Care for America Act: 60 times
Indian Health Care Improvement Act: 56 times
Indian Self-Determination and Education Assistance Act: 45 times
Employee Retirement Income Security Act: 39 times
Medicare Prescription Drug, Improvement, and Modernization Act: 11 times
American Recovery and Reinvestment Act: 7
Sections of the U.S. Code Cited (Properly) Most By H.R. 3962
25 U.S.C. §450. Congressional statement of findings: 38
25 U.S.C. §13. Expenditure of appropriations by Bureau: 13
42 U.S.C. §1396a(a). State plans for medical assistance: 10
42 U.S.C. §1396d(a). Definitions: 7
42 U.S.C. §2004a. Sanitation facilities: 7
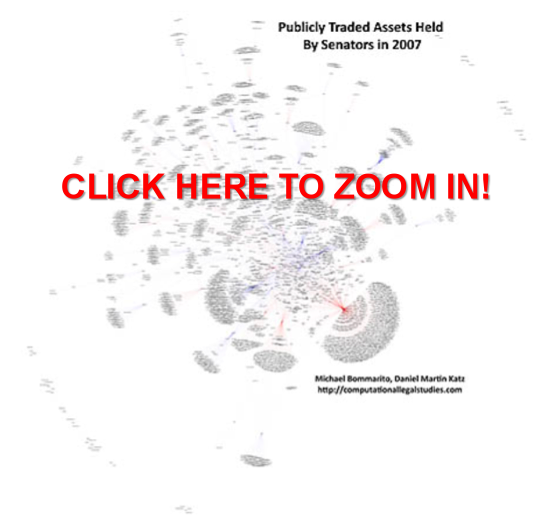
OpenSecrets Open Data! – Visualizing the Publicly Traded Assets of Senators in 2007
OpenSecrets.org went open with their data today. In honor of this very significant act and its ramifications on future government transparency, I’ve decided to produce a quick visualization to answer a question I’ve long been intrigued by – the publicly traded holdings of Senators. One good proxy to this question is the Personal Financial Disclosure data released today by Open Secrets. In the words of Open Secrets,
Any legal ownership a person has in a company or property is classified as an asset, including brokerage accounts, corporate bonds and stocks. For the most part, lawmakers seem to have a stake in big-name, recognizable companies and properties. They need to report only assets worth more than $1,000 at the end of the calendar year, or producing more than $200 of income. (One note about mutual funds: Filers are not required to provide detail on funds’ individual holdings.) Any purchases, sales or exchanges of assets during the year of more than $1,000 must be disclosed as transactions. Reporting the value of a primary residence, unless it produces income, is not required.
This visual represents a very rough cut of this data for the holdings of Senators in 2007. As is often the case with real form data, there are inconsistencies across the data set. Ideally, one could simply use the asset’s description, which would accurately report the assets held in an account. However, as these are not always provided, the “asset source” is used in their absence. When combined with the mutual fund issues mentioned above, blind trust reporting, and these possible transcription errors, there is a compelling case against strict interpretation of this visual. In any case, enjoy the visual, and again, thanks to Open Secrets for their monumental move forward!
Visualizing Contributions to the 110th Congress—House Edition (Take 2)
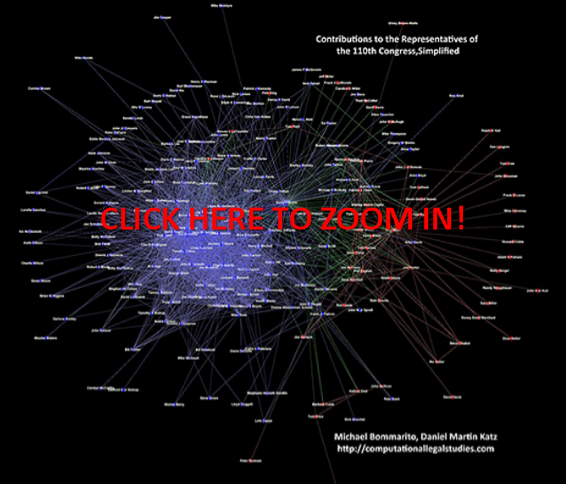
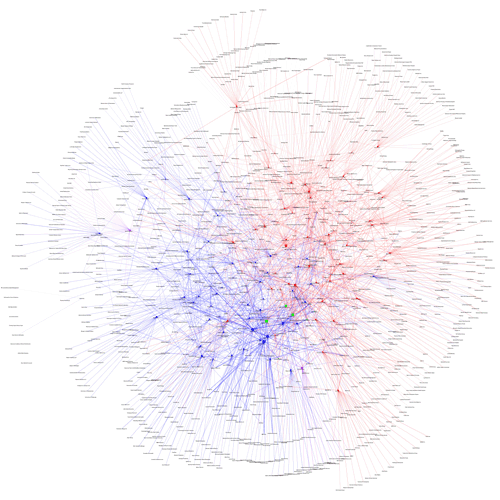
In our previous graph visualizations of contributions to members of the House and Senate, there have been two types of entities: Contributors and Congressmen. This division manifests itself in the dynamics of the graph as well – Contributors give only to Congressmen, and Congressmen receive only from Contributors. A network with this property is bipartite, and there are a number of additional ways to represent the relations contained therein.
One such representation is called the single-mode projection. In this simplification, only elements from one of the two sets (e.g., Congressmen or Contributors) are displayed. A relationship exists between two elements in the visual if they share a relationship with at least one member of the other group. For instance, both Bernie Sanders and Sam Brownback received campaign contributions from the the National Association of Realtors. Thus, the Congressmen both have a relationship with the same Contributor, and the simplest single-mode projection would represent this as a shared relationship between the two Congressmen. For more on this projection or other representations, see Wasserman and Faust (1994) or M. E. J. Newman, S. H. Strogatz, and D. J. Watts, Phys. Rev. E 64, 026118 (2001).
As the Sanders-Brownback example above demonstrates, however, it is relatively easy to be connected in this representation. Thus, we enforce a threshold on the number of shared contributors for a relationship to exist – representatives must shared at least 10 contributors in order for a relationship to exist between them. It is important to note that different thresholds may produce different graphs. We have chosen this figure as it represents roughly half the number of major contributors to the typical representative. Obviously, alternative specifications are possible. In future posts, we may present different thresholds or normalizations. However, for now, we believe this is a simple but appropriate representation for the underlying data.
Given the requirement of sharing at least 10 contributors with another member, the above visualization no longer contains every member of the House of Representatives. To observe the full graph, please see our first post on the contributions to the House.
Interpreting this visual is very similar to previous visuals, and in many ways simpler. Other than points (1) and (2) below, again refer to our first post on the contributions to the House.
(1) SIZING of the CONNECTIONS — Each Connection (Arc) between an Institution and a Member of the House is sized according to the amount of money flowing through a connection. Darker connections represent larger flows of money while lighter connections represent smaller amounts of money.

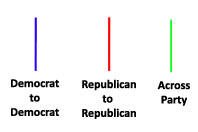
(2) COLORING of the CONNECTIONS — Each connection representing a shared campaign contributor from between members of Congress is colored according to partisan affiliation. Using popular convention, we color shared relationships between Republican Party members as Red, and blue for shared relationships between Democratic Party members. For relationships that span across the party lines, the color green is used.
Co-Sponsorship Networks– Senators of the 108th Congress
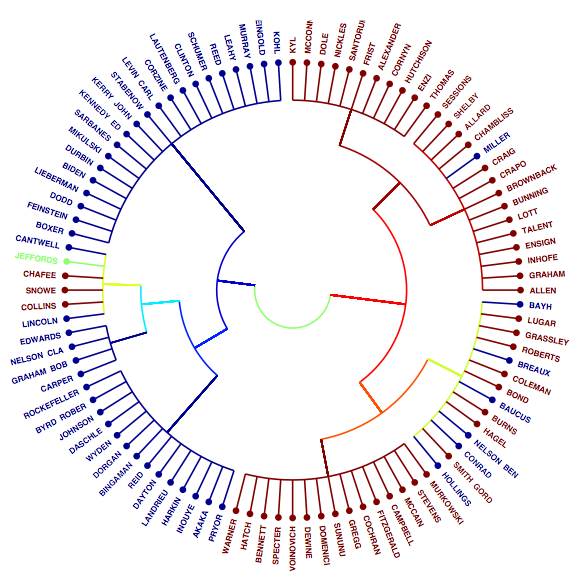
In the days and weeks to come we will turn our attenion away from Congress in favor of other institutions and substantive questions. However, given our prior posts focusing upon the structure of the 110th Congress, we thought it proper to highlight some relevant realted scholarship. James Fowler from the UCSD Political Science Department and leader of the Networks in Political Science movement has published several papers exploring the strucutre of legislative co-sponsorship. You can find a link to these papers here. My favorite of these papers is Community Structure in Congressional Cosponsorship Networks published in Physica A by Yan Zhang, A. J. Friend, Amanda L. Traud, Mason A. Porter, James H. Fowler & Peter J. Mucha. The above figure, drawn from the paper, is a dendrogram for the legislative cosponsorship network of the Senate of the 108th Congress.
Senators of the 110th Congress Take 2-Contributions by Industry/Sector
To view the full image, please click here.
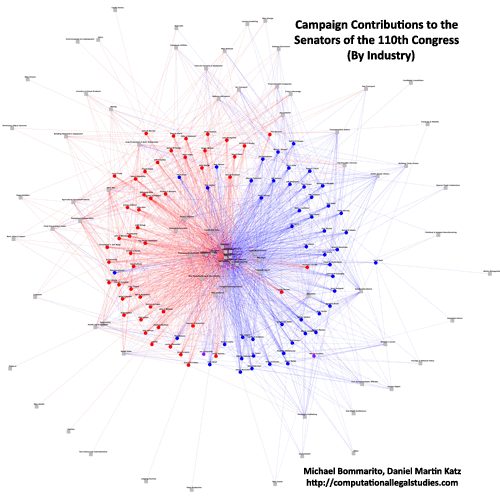
This represents a deeper cut on campaign contributions to the Senators of 110th Congress. Again, we rely upon data from the Center for Responsive Politics. The CRP aggregates contribution data up to the industry or economic sector. Thus, as before, we adopt their classification scheme and methodology herein. While aggregating to the industry/sector level removes the degree of specificity we offered in our earlier post, it provides a cleaner representation for the graph. For those interested in the other chamber, click here for the House of Representatives.
Click on the picture above and it will take you to our flash where you can zoom in and read the labels.
As you review the graph, please consider the following:
(1) Industries locate in the center of the graph because they provide significant funding to both Democrats and Republicans.
(2) Industries which generally only fund one political party are located toward the respective red/blue boundary. For example, it is hardly surprising to observe the location of “Oil and Gas” relative to “Environmental” groups.
(3) It is important to note that we do not impose the partisan separation or the placement of party outliers apparent in the image. Rather, the algorithm places Red Senators in Blue Territory and Blue Senators in Red Territory because they receive significant sums from industries who typically fund the opposing party. For example, consider Senator Olympia J Snowe (R-ME) who is typically characterized as a moderate Republican. Since she receives money from more industries that typically fund Democrats than Republicans, she is placed in Blue Territory by the algorithm.
(4) It is important not to over read the position of Senator Herb Kohl (D-WI). Over the relevant time window, Senator Kohl received 94% of his resources through self-financing.
Visualizing the Campaign Contributions to Senators in the 110th Congress — The TARP EDITION (The Image)
As part of our commitment to provide original content, we offer a Computational Legal Studies approach to the study of the current campaign finance environment. If you click below you can zoom in and read the labels on the institutions and the senators. The visualization memorializes contributions to the members of the 110th Congress (2007 -2009). Highlighted in green are the primary recipients of the TARP.
In the post below, we offer detailed documentation of this visualization.
Three Important Principles: (1) Squares (i.e. Institutions) introduce money into the system and Circles (i.e. Senators) receive money (2) Both Institutions and Senators are sized by dollars contributed or dollars received (3) Senators are colored by Party.
To view the full image, please click here.
To view the full image, please click here.
By Michael Bommarito and Daniel Martin Katz.
Center for the Study of Complex Systems
Department of Political Science
University of Michigan, Ann Arbor


