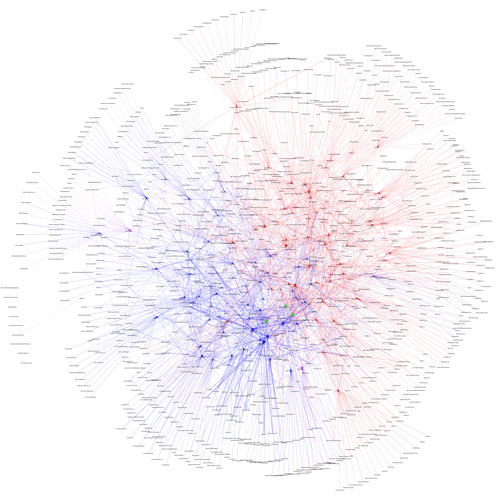
As part of our commitment to provide original content, we offer a Computational Legal Studies approach to the study of the current campaign finance environment. If you click below you can zoom in and read the labels on the institutions and the senators. The visualization memorializes contributions to the members of the 110th Congress (2007 -2009). Highlighted in green are the primary recipients of the TARP.
In the post below, we offer detailed documentation of this visualization.
Three Important Principles: (1) Squares (i.e. Institutions) introduce money into the system and Circles (i.e. Senators) receive money (2) Both Institutions and Senators are sized by dollars contributed or dollars received (3) Senators are colored by Party.
To view the full image, please click here.
To view the full image, please click here.
By Michael Bommarito and Daniel Martin Katz.
Center for the Study of Complex Systems
Department of Political Science
University of Michigan, Ann Arbor


Michael And Daniel,
Great Graphic! I would find it useful to have a listing of contributors for Senators based on an Industrial Sector breakdown. Is that possible from your data?
Martha Bush
incredible. you guys should win a nobel in economics for this.
Please, check out the work of Mark Lombardi, a systems analyst who turned artist. You guys should have a gallery show.