OpenSecrets Open Data! – Visualizing the Publicly Traded Assets of Senators in 2007

picture-36


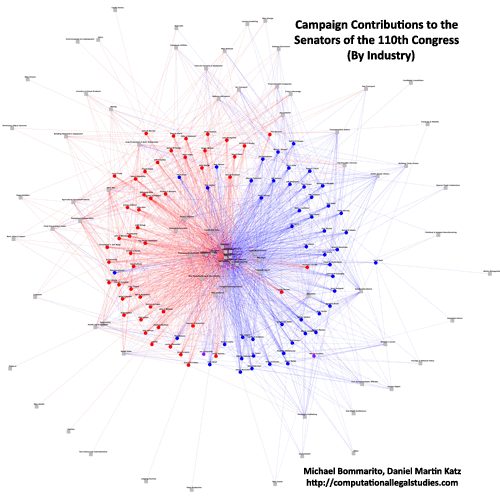
OpenSecrets.org went open with their data today.  In honor of this very significant act and its ramifications on future government transparency, I’ve decided to produce a quick visualization to answer a question I’ve long been intrigued by – the publicly traded holdings of Senators.  One good proxy to this question is the Personal Financial Disclosure data released today by Open Secrets.  In the words of Open Secrets,

Any legal ownership a person has in a company or property is classified as an asset, including brokerage accounts, corporate bonds and stocks. For the most part, lawmakers seem to have a stake in big-name, recognizable companies and properties. They need to report only assets worth more than $1,000 at the end of the calendar year, or producing more than $200 of income. (One note about mutual funds: Filers are not required to provide detail on funds’ individual holdings.) Any purchases, sales or exchanges of assets during the year of more than $1,000 must be disclosed as transactions. Reporting the value of a primary residence, unless it produces income, is not required.

This visual represents a very rough cut of this data for the holdings of Senators in 2007.  As is often the case with real form data, there are inconsistencies across the data set.  Ideally, one could simply use the asset’s description, which would accurately report the assets held in an account.  However, as these are not always provided, the “asset source” is used in their absence.  When combined with the mutual fund issues mentioned above, blind trust reporting, and these possible transcription errors, there is a compelling case against strict interpretation of this visual.  In any case, enjoy the visual, and again, thanks to Open Secrets for their monumental move forward!

Senators of the 110th Congress Take 2-Contributions by Industry/Sector

To view the full image, please click here.

Senator By Industry


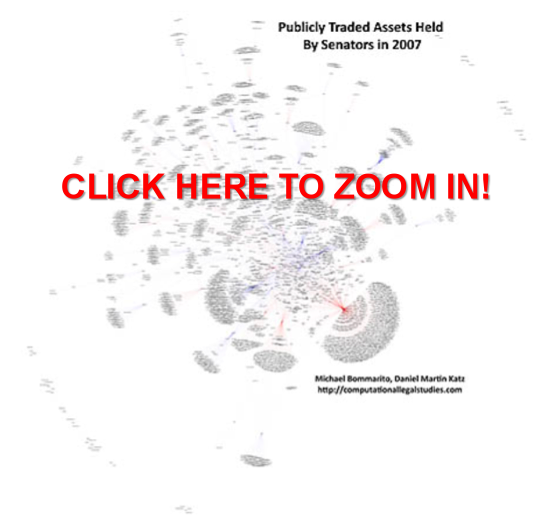
This represents a deeper cut on campaign contributions to the Senators of 110th Congress. Again, we rely upon data from the Center for Responsive Politics.  The CRP aggregates contribution data up to the industry or economic sector. Thus, as before, we adopt their classification scheme and methodology herein.  While aggregating to the industry/sector level removes the degree of specificity we offered in our earlier post, it provides a cleaner representation for the graph.  For those interested in the other chamber, click here for the House of Representatives.

Click on the picture above and it will take you to our flash where you can zoom in and read the labels.

As you review the graph, please consider the following:

(1) Industries locate in the center of the graph because they provide significant funding to both Democrats and Republicans.

(2) Industries which generally only fund one political party are located toward the respective red/blue boundary.  For example, it is hardly surprising to observe the location of “Oil and Gas” relative to “Environmental” groups.

(3) It is important to note that we do not impose the partisan separation or the placement of party outliers apparent in the image. Rather, the algorithm places Red Senators in Blue Territory and Blue Senators in Red Territory because they receive significant sums from industries who typically fund the opposing party. For example, consider Senator Olympia J Snowe (R-ME) who is typically characterized as a moderate Republican.  Since she receives money from more industries that typically fund Democrats than Republicans, she is placed in Blue Territory by the algorithm.

(4) It is important not to over read the position of Senator Herb Kohl (D-WI).  Over the relevant time window, Senator Kohl received 94% of his resources through self-financing.