6,000 Pages Tell the World’s History [via GE Data Visualization]

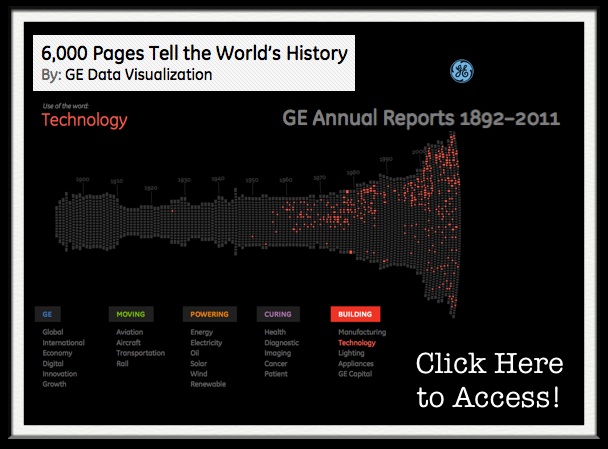
“It’s true. We’ve scanned 6,000 pages of GE’s annual reports to build this interactive visualization. But why? What’s the point? Not only does this provide a rich history of how GE has always been at work building, moving, powering and curing the world, but it is a true reflection of how the economy, U.S. and the world as a whole has progressed from 1892 until 2011. By diving deep into key terms, users can uncover interesting stories about innovation over the last century. Explore for yourself!

About this data: The data in this visualization is sourced from all of GE’s annual reports from 1892 until 2011.”

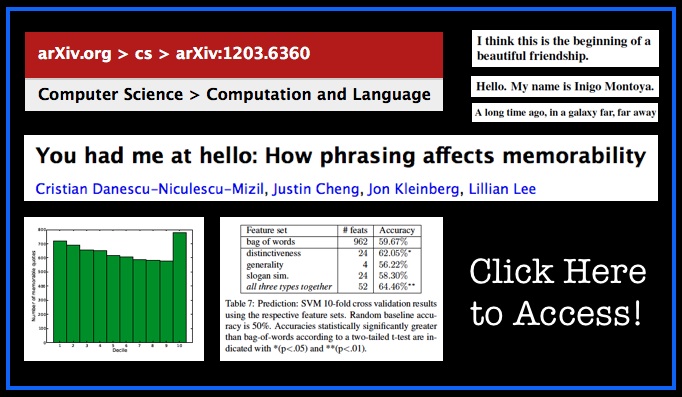
You Had Me at Hello: How Phrasing Affects Memorability [via arXiv.org]

From the Abstract: “Understanding the ways in which information achieves widespread public awareness is a research question of significant interest. We consider whether, and how, the way in which the information is phrased — the choice of words and sentence structure — can affect this process. To this end, we develop an analysis framework and build a corpus of movie quotes, annotated with memorability information, in which we are able to control for both the speaker and the setting of the quotes. We find significant differences between memorable and non-memorable quotes in several key dimensions. One is lexical distinctiveness: in aggregate, memorable quotes use less common word choices, but at the same time are built upon a scaffolding of common syntactic patterns; another is that memorable quotes tend to be more general in ways that make them easy to apply in new contexts. We also show how the concept of “memorable language” can be extended across domains.”

Interactive Dynamics for Visual Analysis (By Jeffrey Heer & Ben Shneiderman)

From the Abstract: “The increasing scale and availability of digital data provides an extraordinary resource for informing public policy, scientific discovery, business strategy, and even our personal lives. To get the most out of such data, however, users must be able to make sense of it: to pursue questions, uncover patterns of interest, and identify (and potentially correct) errors. In concert with data-management systems and statistical algorithms, analysis requires contextualized human judgments regarding the domain-specific significance of the clusters, trends, and outliers discovered in data.

Visualization provides a powerful means of making sense of data. By mapping data attributes to visual properties such as position, size, shape, and color, visualization designers leverage perceptual skills to help users discern and interpret patterns within data. A single image, however, typically provides answers to, at best, a handful of questions. Instead, visual analysis typically progresses in an iterative process of view creation, exploration, and refinement. Meaningful analysis consists of repeated explorations as users develop insights about significant relationships, domain-specific contextual influences, and causal patterns. Confusing widgets, complex dialog boxes, hidden operations, incomprehensible displays, or slow response times can limit the range and depth of topics considered and may curtail thorough deliberation and introduce errors. To be most effective, visual analytics tools must support the fluent and flexible use of visualizations at rates resonant with the pace of human thought.

The goal of this article is to assist designers, researchers, professional analysts, procurement officers, educators, and students in evaluating and creating visual analysis tools. We present a taxonomy of interactive dynamics that contribute to successful analytic dialogues.”    [HT: Flowing Data]
The Age of Big Data [via NY Times]

Please read this article and ask yourself how can we get in front of this – both as a profession and as an academy.

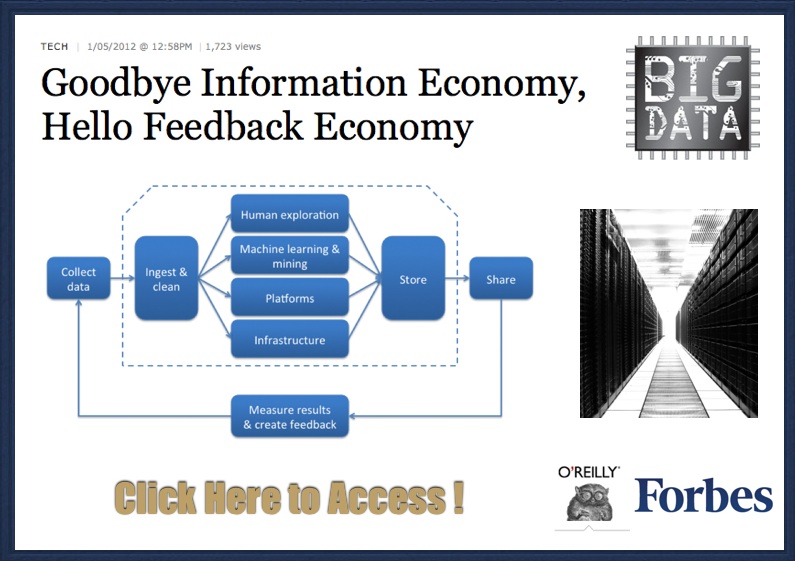
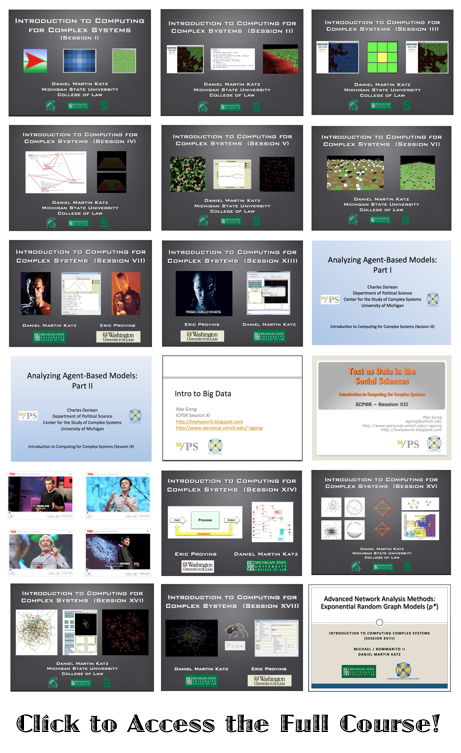
Big Data and ‘Soft’ Artificial Intelligence are the center piece of my presentation and forthcoming paper the Age of Quantitative Legal Prediction. For the legal services industry, a very different world  is coming (is already here in certain circles). As a Law Professor, I am preparing my students to be the leaders in this world with my Quantitative Methods for Lawyers course, Legal Information Technology & Engineering (London Summer Program), E-Discovery as well as several other courses that my MSU colleagues and I are developing.

As I said to start the year – it is time to step up your game.  🙂

LegalTech 2012 NYC – The Power of Data, Prediction and Tectonic Changes in the Business of Law

I am at the New York Hilton right now for Legal Tech NYC 2012.  I am very pleased that I was asked to speak at this important conference.

For those of you considering attending law school (particularly those with a technical prior background) please understand that although it may appear so on first glance – not all law schools are alike.  At MSU Law, we are fully engaged in what is happening in the legal services industry. Things are changing very quickly and we are working to adapt rapidly to that change.

For example, we are in the process of proposing or rolling new courses including – Quantitative Methods for Lawyers (which focuses on quantitative thinking, technology and the business of law practice), E-Discovery, Entrepreneurial Lawyering as well as several others (to be announced).

In addition, we have just started our 21st Century Law Practice – London Summer Program which is “a first of its kind, intensive study of technology, innovation, deregulation, entrepreneurship and the international legal marketplace. With the deregulation of lawyers in the United Kingdom and the outgrowth of alternative legal services delivery models, London is poised to become the global leader in the legal services market. Our program will educate students about these new delivery models and help prepare students for the technology infused law jobs of the 21st Century.”

Anyway, I look forward to speaking tomorrow. If you are here for #LTNY please feel to drop in at the session — I will be speaking tomorrow about Quantitative Legal Prediction from 1:45pm – 3:00pm in The Power of Data section.