–
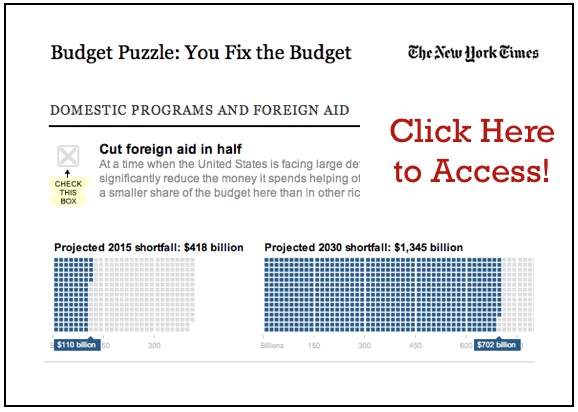
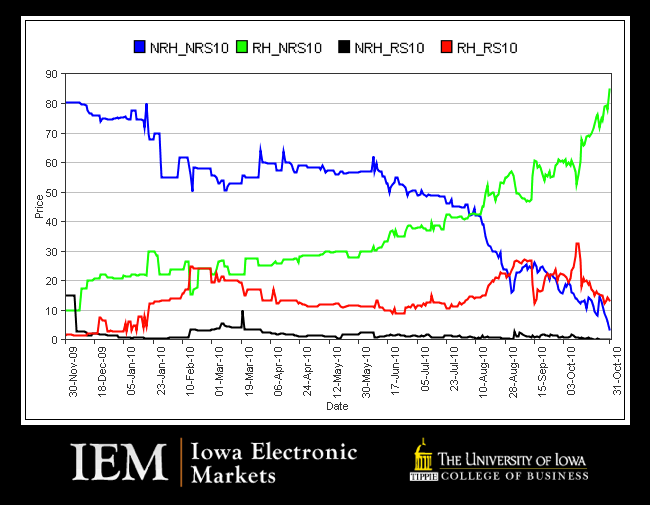
Budget Puzzle: You Fix the Budget [NY Times]
While some of these cost and revenue projections could be debated, the New York Times has developed a nifty interface that allows end users to consider how they would attack the problem of deficit reduction. Using the New York Times Budget puzzle, here is my approach. In developing my approach, I tried to consider a configuration that I thought could actually attract majority support in a time of divided government. Thus, I leaned pretty hard on spending cuts (70%) with relatively fewer tax increases (30%). Obviously, your are free to disagree but I would suggest that try it for yourself and see where you come out.
Announcing the Beta Prerelease of the New Electronic World Treaty Index [Version 3]
What is the World Treaty Index?
The World Treaty Index (WTI), originally compiled by Peter Rohn in the 1960s and 1970s and subsequently maintained and updated at the University of Washington, is a comprehensive list of all known treaties formed during the twentieth century. This includes not only treaties formally registered with the United Nations (UNTS) but a significant number of unregistered agreements.
What information does the World Treaty Index provide?
The WTI provides information on the parties to the agreement, the general topic of the agreement (e.g. trade agreement, tax agreement, an arms control agreement, etc.), as well as the signing date and the date in force, and the volume and page containing the text of the agreement. Though the WTI does not provide the full text of each agreement, it is an excellent resource for identifying when a state (or states) formed a number of international agreements of a particular type. With a list of relevant agreements (including their volume and page number), an end user interested in obtaining the full text can simply collect them using the primary source material (i.e. UNTS, LTS, etc.)
Who is currently administrating the World Treaty Index?
The Electronic WTI is now housed at the University of Michigan and administrated by Michael Bommarito, Daniel Martin Katz and Paul Poast. We are highlighting the newly constructed – Beta Prerelease of the WTI website in an effort to obtain feedback prior to the official release. The currently available product provides access to information on more than 58,000 bilateral and multilateral treaties formed between 1900 and 1997. When full coverage for the 20th century is complete, the database should feature in excess of 60,000 agreements.
What are some examples of searches I can conduct on the World Treaty Index website?
While the WTI should support all browsers, we suggest using Firefox. Below are three sample searches.
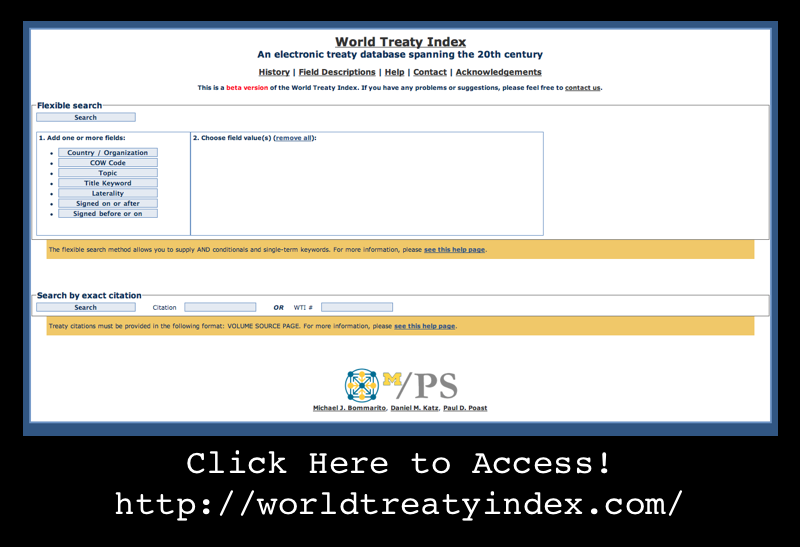
Search #1: Suppose a user would like to collect all agreements involving Brazil. Use the “flexible search” and follow three easy steps. (A) Select the country/organization field (B) within the country/organization field set the field value = Brazil (C) click the search button.
Search #2: Suppose a user would like to collect all agreements between Mexico and Spain. Use the “flexible search” and follow five easy steps. (A) Select the country/organization field (B) within the country/organization field set the field value = Mexico (C) Select a second country/organization field (B) within this new country/organization field set the field value = Spain (E) now click the search button.
Search #3: Suppose a user would like to know how many extradition agreements France signed between 1950 and 1962. This is similar to the examples above but involves the topic, signed on or after and signed before or on fields. After the user chooses the proper search fields and selects the search information, the WTI will produce on the screen a list of the desired agreements and provide the option of downloading the list as a CSV file.
When will it feature full coverage for the entire 20th Century?
By the end of 2010, we will add (1) all bilateral treaties formed between 1900 and 1944 [Now Mostly Complete] (2) all bilateral treaties formed between 1998 and 1999, and (3) all multilateral agreements and a list of all parties to each multilateral agreement. If you know of an agreement that is not ultimately featured on the site please contact us and we will be happy to add it to the list.
How can I learn more about the World Treaty Index?
For a general history of the World Treaty Index, visit the “History Page” on the worldtreatyindex.com website. For a more detailed treatment please see: Glenda Pearson, Rohn’s World Treaty Index: Its Past and Future, 29 International Journal of Legal Information 543 (2001).
What additional extensions of the Electronic World Treaty Index are planned?
As noted above, our initial goal is provide complete coverage of all known agreements in the 20th Century. Planned extensions include bringing the World Treaty forward so as to provide coverage up to 2010. In addition, we plan to collect information regarding treaty terminations. Finally, we would like to enhance the granularity of our topic codes and allow for agreements with multiple dimensions to feature multiple topic codes.
Feedback?
At this point, we have only offered a beta pre-release of the site. Thus, we would really appreciate your feedback, etc. Please email us at worldtreatyindex@gmail.com if you have any thoughts about how to improve the site.
The Development of Structure in the Citation Network of the United States Supreme Court — Now in HD! [Repost]

What are some of the key takeaway points?
(1) The Supreme Court’s increasing reliance upon its own decisions over the 1800-1830 window.
(2) The important role of maritime/admiralty law in the early years of the Supreme Court’s citation network. At least with respect to the Supreme Court’s citation network, these maritime decisions are the root of the Supreme Court’s jurisprudence.
(3) The increasing centrality of decisions such as Marbury v. Madison, Martin v. Hunter’s Lessee to the overall network.
The Development of Structure in the SCOTUS Citation Network
The visualization offered above is the largest weakly connected component of the citation network of the United States Supreme Court (1800-1829). Each time slice visualizes the aggregate network as of the year in question.
In our paper entitled Distance Measures for Dynamic Citation Networks, we offer some thoughts on the early SCOTUS citation network. In reviewing the visual above note ….“[T]he Court’s early citation practices indicate a general absence of references to its own prior decisions. While the court did invoke well-established legal concepts, those concepts were often originally developed in alternative domains or jurisdictions. At some level, the lack of self-reference and corresponding reliance upon external sources is not terribly surprising. Namely, there often did not exist a set of established Supreme Court precedents for the class of disputes which reached the high court. Thus, it was necessary for the jurisprudence of the United States Supreme Court, seen through the prism of its case-to-case citation network, to transition through a loading phase. During this loading phase, the largest weakly connected component of the graph generally lacked any meaningful clustering. However, this sparsely connected graph would soon give way, and by the early 1820’s, the largest weakly connected component displayed detectable structure.”
What are the elements of the network?
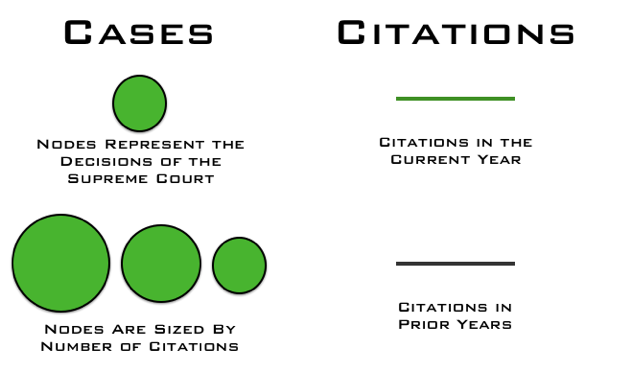
What are the labels?
To help orient the end-user, the visualization highlights several important decisions of the United States Supreme Court offered within the relevant time period:
Marbury v. Madison, 5 U.S. 137 (1803) we labeled as ”Marbury”
Murray v. The Charming Betsey, 6 U.S. 64 (1804) we labeled as “Charming Betsey”
Martin v. Hunter’s Lessee, 14 U.S. 304 (1816) we labeled as “Martin’s Lessee”
The Anna Maria, 15 U.S. 327 (1817) we labeled as “Anna Maria”
McCulloch v. Maryland, 17 U.S. 316 (1819) we labeled as “McCulloch”
Why do cases not always enter the visualization when they are decided?
As we are interested in the core set of cases, we are only visualizing the largest weakly connected component of the United States Supreme Court citation network. Cases are not added until they are linked to the LWCC. For example, Marbury v. Madison is not added to the visualization until a few years after it is decided.
How do I best view the visualization?
Given this is a high-definition video, it may take few seconds to load. We believe that it is worth the wait. In our view, the video is best consumed (1) Full Screen (2) HD On (3) Scaling Off.
Where can I find related papers?
Here is a non-exhaustive list of related scholarship:
Michael Bommarito, Daniel Katz, Jon Zelner & James Fowler, Distance Measures for Dynamic Citation Networks, Physica A __ (2010 Forthcoming).
Yonatan Lupu & James Fowler, The Strategic Content Model of Supreme Court Opinion Writing, APSA 2009 Toronto Meeting Paper.
Michael Bommarito, Daniel Katz & Jon Zelner, Law as a Seamless Web? Comparison of Various Network Representations of the United States Supreme Court Corpus (1791-2005) in Proceedings of the 12th Intl. Conference on Artificial Intelligence and Law (2009).
Frank Cross, Thomas Smith & Antonio Tomarchio, The Reagan Revolution in the Network of Law, 57 Emory L. J. 1227 (2008).
James Fowler & Sangick Jeon, The Authority of Supreme Court Precedent, 30 Soc. Networks 16 (2008).
Elizabeth Leicht, Gavin Clarkson, Kerby Shedden & Mark Newman, Large-Scale Structure of Time Evolving Citation Networks, 59 European Physics Journal B 75 (2007).
Thomas Smith, The Web of the Law, 44 San Diego L.R. 309 (2007).
James Fowler, Timothy R. Johnson, James F. Spriggs II, Sangick Jeon & Paul J. Wahlbeck, Network Analysis and the Law: Measuring the Legal Importance of Precedents at the U.S. Supreme Court, 15 Political Analysis, 324 (2007).
_
Bloomberg Government – Another Tool for Navigating the Increasingly Complex Information Environment?
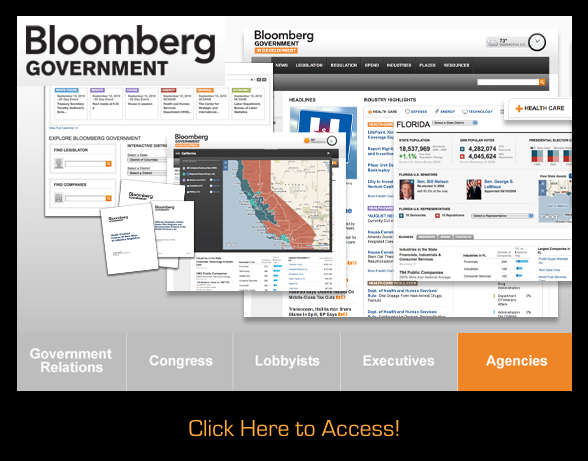
While I am hardly here to shill for Bloomberg, the introduction of Bloomberg Government into the market for government information does represent an important development worthy of highlighting. Coverage from a few weeks back is located here and here.
While I hope to explore the actual product in the coming months, the front page highlights both its coverage and its informational interface. Whether aimed at sophisticated and non sophisticated actors, the selection of this sort of dashboard style interface is important as it is precisely the sort of HCI that has been shown to help end users navigate complex information environments.
The ever increasing access to digitized governmental information provides a real arbitrage opportunity for a specific firm to serve as the default third party provider of that information. Whether Bloomberg Government will fill this void is likely a function of (1) the novelity of its informational inputs and (2) the quality of the HCI experienced by target end users. Only time will tell…
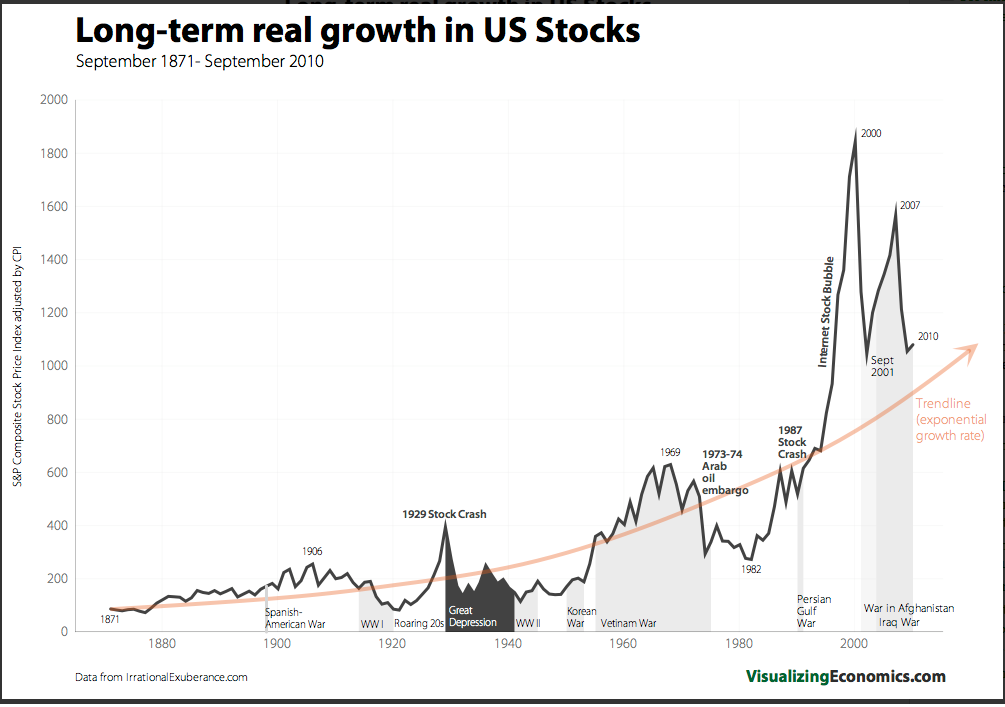
Exponential Growth Rate of US Stocks since 1871 [ Via Visualizing Economics ]
If you would like to see this chart plotted on a log scale click here. Also, Visualizing Economics has a number of other very interesting projects worth checking out.
Introduction to Computing for Complex Systems — ICPSR 2010 — My Full Course Slides Available Online!
I am going to bump this post to front of the blog one last time as there has been some interest in this material. It has now been several weeks since we completed the full four week class here at the ICPSR Program in Quantitative Methods. In this course, I (together with my colleagues) highlight the methods of complex systems as well as several environments designed to explore the field. These include Netlogo (agent based models and network models), Vensim (system dynamics / ecological modeling) and Pajek (empirical network analysis). In the final week, we cover a variety of advanced topics:
- (a) Community Detection in Networks
- (b) Computational Linguistics / Natural Language Processing
- (c) Diffusion Models and Mathematical Modeling with Data
- (d) Exponential Random Graph (p*) Models
- (e) Information Retrieval / Webscraping
Although, we do not work with more advanced languages within the course, those who need to conduct complex analysis are directed to alternatives such as R, Python, Java, etc.
Anyway, the slides are designed to be fully self-contained and thus allow for individually paced study of the relevant material. If you work through the slides carefully you should be able to learn the software as well as many of the core principles associated with the science of complex systems. The material should be available online indefinitely. If you have questions, feel free to email me.
“Peak Data” or “The Capacity Crunch” [From Science]
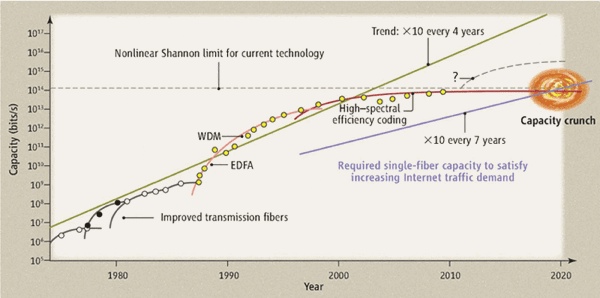
From this week’s issue of Science comes Filling the Light Pipe by David J. Richardson. This is an important article highlighting a serious challenge facing the both the scientific and policy community.
From the abstract: “It has been a landmark year for the field of optical telecommunications, with the award of the 2009 Nobel Prize to Charles Kao for his insight in the mid-1960s that the future of communications lay in single-mode silica-based optical fibers (1) as well as the 50th anniversary of the first demonstration of the laser—both key technologies responsible for the development of the global-scale communications networks of today (2). Recently, however, a growing realization has emerged within the telecommunications industry that the end of the phenomenal growth in optical fiber communication capacity is within sight. At this year’s Optical Fiber Communication Conference (OFC 2010), several groups reported results within a factor of  2 of the ultimate capacity limits of existing optical fiber technology. Without radical innovation in our physical network infrastructure—that is, improvements in the key physical properties of transmission fibers and the optical amplifiers that we rely on to transmit data over long distances—we face what has been widely referred to as a “capacity crunch” that could severely constrain future Internet growth, as well as having social and political ramifications.”
[HT to Paul Kedrosky]

