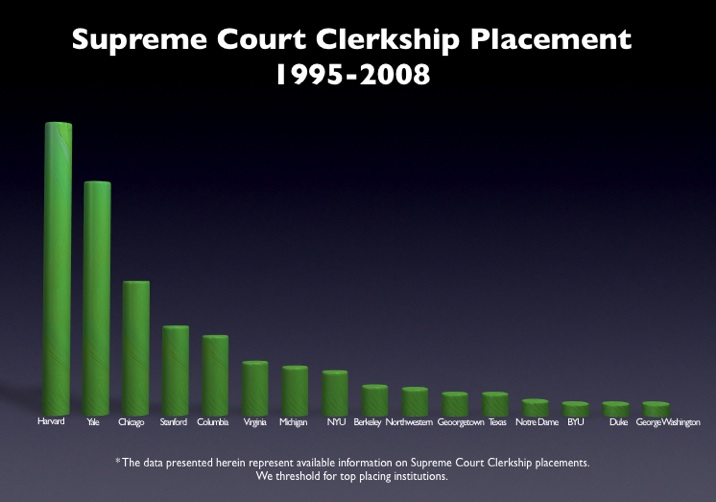
As part our multipart series on the clerkship tournament, here is a simple bar graph for the top placing law schools in the Supreme Court Clerkship Tourney. It is important to note that we do not threshold for the number of graduates per school. Specifically, we do not just divide by the number graduates per school because we have little theoretic reason to believe that placements linearly scale to differences in size of graduating classes. In other words, given we do not know the proper functional form — we just offer the raw data. For those interested in other posts, please click here for the law clerks tag.
Author: clsadmin
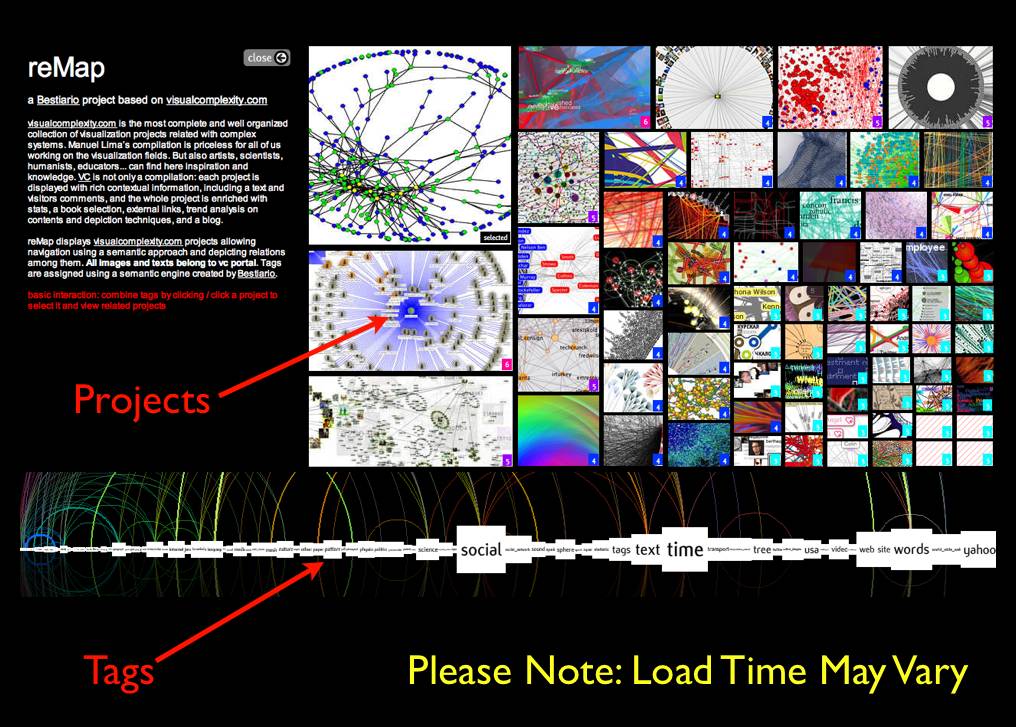
The Map of the Future [From Densitydesign.org]
 As we mentioned in previous posts, Seadragon is a really cool product. Please note load times may vary depending upon your specific machine configuration as well as the strength of your internet connection. For those not familiar with how to operate it please see below. In our view, the Full Screen is best the way to go ….
Who Should Win (probably not who will win) the 2009 Sveriges Riksbank Prize in Economic Sciences in Memory of Alfred Nobel
Benoît Mandelbrot whose classic work on fractals as well as more recent work questioning the Efficient Market Hypothesis offers a lasting contribution to positive economic theory. While the committee is likely considering Eugene Fama and/or Kenneth French (of Fama-French fame), we believe they should instead consider Mandelbrot (or at a minimum split the award between Fama, French & Mandelbrot).
Robert Axelrod whose work on the evolution of cooperation is among the most cited work in all of the social sciences. Iterated Prisoners Dilemma as well as concepts such Tit for Tat are part of the cannon of almost all introductory courses in game theory.
Robert Shiller for his contributions to behavioral finance including his work challenging the Efficient Market Hypothesis. Of course, Shiller is also well known for his work on the real estate market with Karl Case (including the Case-Shiller Index). This also represents important work worthy of recognition.
Elinor Ostrom for her work on public choice theory, common pool resources and collective action. Her work has offered a substantial contribution to political economy as well as institutional and environmental economics. {Note: (Ladbrokes places her at 50 to 1)}.
UPDATE: ELINOR OSTROM AND OLIVER WILLIAMSON WIN THE 2009 NOBEL PRIZE {In Our Estimation, this is a Very Appropriate Decision }
Programming Dynamic Models in Python
 In this series of tutorials, we are going to focus on the theory and implementation of transmission models in some kind of population.
In epidemiology, it is common to model the transmission of a pathogen from one person to another. In the social sciences and law, we may be interested in thinking about the way in which individuals influence each other’s opinions, ideology and actions.
These two examples are different, but in many ways analogous: it is not difficult to imagine the influence that one individual has on another as being similar to the infectivity of a virus in the sense that both have the ability to change the state of an individual. One may go from being susceptible to being infected, or from unconvinced to convinced.
Additionally, social networks have become an important area of study for epidemiological modelers. We can imagine that the nature of the network is different than the ones we think about in the social sciences: when studying outbreaks of a sexually transmitted disease, one doesn’t care all that much about the friendship networks of the people involved, while this would be very important for understanding the impact of social influence on depression and anxiety.
As someone who spends a lot of time working in the space where epidemiology and sociology overlap, I end up thinking a lot about these models – and their potential application to new and different problems and am really excited to share them with a broader audience here. In this first tutorial, I’m going to introduce a simple Susceptible-Infected-Recovered (SIR) model from infectious disease epidemiology and show a simple, Pythonic implementation of it. We’ll work through the process of writing and optimizing this kind of model in Python and, in the final tutorials, will cover how to include a social network in the simulation model.
In order to use the example below, all you need to have installed is a current version of Python (2.4+ is probably best) and the excellent Python plotting package Matplotlib in order to view output. If you don’t have Matplotlib and don’t want to go and install it (although I guarantee you won’t regret it), just comment out import for Pylab and any lines related to plotting.
Model Assumptions
1. State Space / Markov Model
Before getting into the mechanics of the model, let’s talk about the theory and assumptions behind the model as it is implemented here:
The SIR model is an example of a ‘state space‘ model, and the version we’ll be talking about here is a discrete time, stochastic implementation that has the Markov property, which is to say that its state at time t+1 is only conditional on the parameters of the model and its state at time t.
For the uninitiated, in a state-space model, we imagine that each individual in the system can only be in one state at a time and transitions from state to state as a function of the model parameters, i.e., the infectivity of the pathogen or idea and the rate of recovery from infection…and the other states of the system. In other words, the system has endogenous dynamics. This is what makes it both interesting and in some ways difficult to work with.
In the SIR model, we assume that each infectious individual infects each susceptible individual at rate beta. So, if beta = .5, there is a 50% chance that each susceptible individual will be infected by an exposure to an infectious individual. For this reason, as the number of infected individuals in the system grows, the rate at which the remaining susceptible individuals is infected also grows until the pool of susceptible individuals is depleted and the epidemic dies out.
The other parameter we care about is gamma, or the rate of recovery. If gamma is also equal to .5, we assume that the average individual has a 50% chance of recovering on a given day, and the average duration of infectiousness will be 1/gamma, or 2 days.
We refer to the ratio beta/gamma as the basic reproductive ratio, or Ro (‘R naught’). When this number is less than one, we typically expect outbreaks to die out quickly. When this quantity is greater than one, we expect that the epidemic will grow and potentially saturate the whole population.
2. Homogeneous Mixing:
We’re assuming a world in which everyone has simultaneous contact with everyone else. In other words, we’re thinking of a totally connected social network. If you’re a regular reader of this blog, a social network enthusiast, or in some other way a thinking person, this assumption probably seems unreasonable. It turns out, however, that for many diseases, this assumption of homogeneous or ‘mass-action’ mixing, which was actually originally borrowed from chemistry, turns out to be a reasonable approximation.
For instance, if we are trying to approximate the transmission dynamics of a very infectious pathogen like measles in a city or town, we can usually overlook social network effects at this scale and obtain a very good fit to the data. This is because even very weak contacts can transmit measles, so that friendships and other types of close contacts are not good predictors of risk. Instead, we we are better off looking at a higher level of organization – the pattern of connection between towns and cities to understand outbreaks. In a social context, something like panic may be thought of as being super-infectious (for a really interesting study about the potential relationship between social panic and flu dynamics, see this paper by Josh Epstein).
This is, however, a generally problematic assumption for most problems of social influence, but an understanding of this most basic version of the model is necessary to move on to more complicated contact patterns.
3. Exponentially distributed infectious periods:
In the most basic implementation of the SIR model, we assume that each infectious individual has some probability of recovering on every step. If our model steps forwards in days and individuals have a .5 probability of recovery on each day, we should expect that the time to recovery follows an exponential distribution. This means that most people will be pretty close to the mean, but some will take a relatively long time to recover. This is accurate for a lot of cases, but definitely not for all. In some diseases, recovery times may be lognormal, power-law or bimodally disributed. For social models, the notion of an ‘infectious period’ may not make a tremendous amount of sense at all. But it allows for a very simple and transparent implementation, so we’ll use it here.
CLICK THROUGH TO SEE THE IMPLEMENTATION and RELEVANT PYTHON CODE!
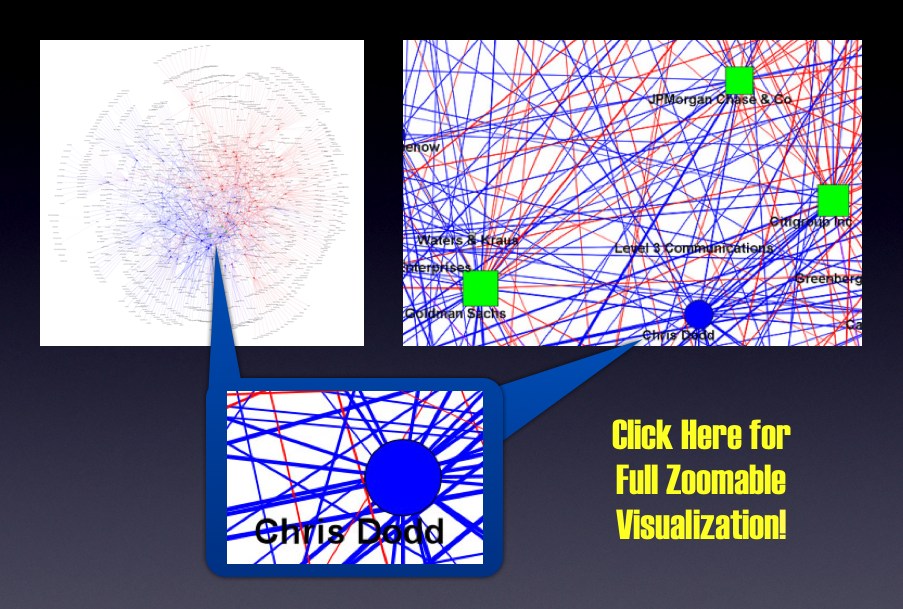
Visualizing the Campaign Contributions to Senators in the 110th Congress — The TARP EDITION [Repost from 3/26])
This is a repost our previous Senators of the 110th Congress Campaign Finance Visualization. Last week we highlighted one specific element of the graph (i.e. Senator Dodd and the TARP Banks). Now, we wanted to bring the full graph back to the front of the page for your consideration. Here is the content of the old post with a few small additions….
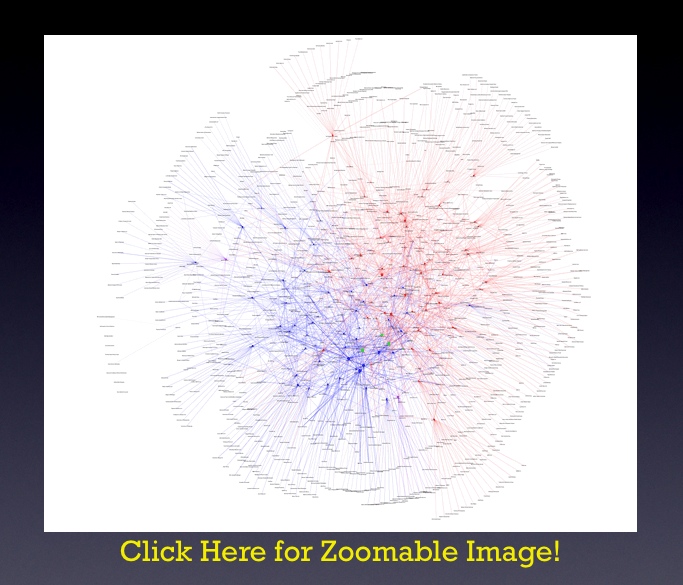
“As part of our commitment to provide original content, we offer a Computational Legal Studies approach to the study of the current campaign finance environment. If you click below you can zoom in and read the labels on the institutions and the senators. The visualization memorializes contributions to the members of the 110th Congress (2007 -2009). Highlighted in green are the primary recipients of the TARP.
In the post below, we offer detailed documentation of this visualization. One Important Point the Visualization Algorithm we use does force the red team, blue team separation. Rather, the behavior of firms and senators produces the separation.
Four Important Principles: (1) Squares (i.e. Institutions) introduce money into the system and Circles (i.e. Senators) receive money (2) Both Institutions and Senators are sized by dollars contributed or dollars received– Larger = More Money (3) Senators are colored by Party. (4) The TARP Banks are colored in Green. “
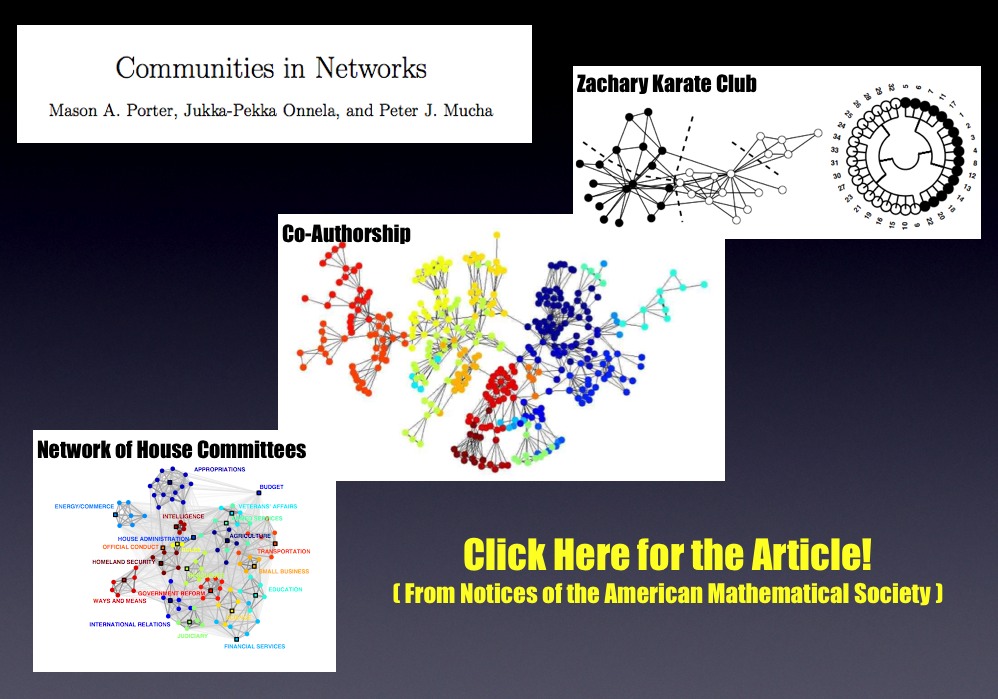
Algorithmic Community Detection in Networks
Community detection in networks is an extremely important part of the broader network science literature. For quite a while, we have meant to highlight the extremely useful review article written by Mason Porter (Oxford) Jukka-Pekka Onnela (Harvard/Oxford) and Peter J Mucha (UNC). Rather than offer our description of the article, we thought it best to highlight commentary on the subject provided by the authors.
For example, in describing the paper over at Harvard’s Complexity and Social Networks Blog Jukka-Pekka Onnela posted the following… “Uncovering the “community” structure of social networks has a long history, but communities play a pivotal role in almost all networks across disciplines. Intuitively, one can think of a network community as consisting of a group of nodes that are relatively densely connected to each other but sparsely connected to other dense groups of nodes. Communities are important because they are thought to have a strong bearing on functional units in many networks. So, for example, communities in social networks can correspond to different social groups, such as family, whereas web pages dealing with a given subject tend to form topical communities. The concept is simple enough, but it turns out that coming up with precise mathematical definitions and algorithms for community detection is one of the most challenging problems in network science. Recently, a lot of the research in this area has been done using ideas from statistical physics, which has an arsenal of tools and concepts to tackle the problem. Unfortunately (but understandably) relatively few non-physicists like to read statistical physics papers.”
These scholars quote Mark Newman noting “[T]he development of methods for finding communities within networks is a thriving sub-area of the field, with an enormous number of different techniques under development. Methods for understanding what the communities mean after you find them are, by contrast, still quite primitive, and much needs to be done if we are to gain real knowledge from the output of our computer programs.” They later note “the problem of how to validate and use communities once they are identified is almost completely open.”
Anyway, if you are interested in learning more about this important piece of the network science toolkit … we suggest you read this paper!
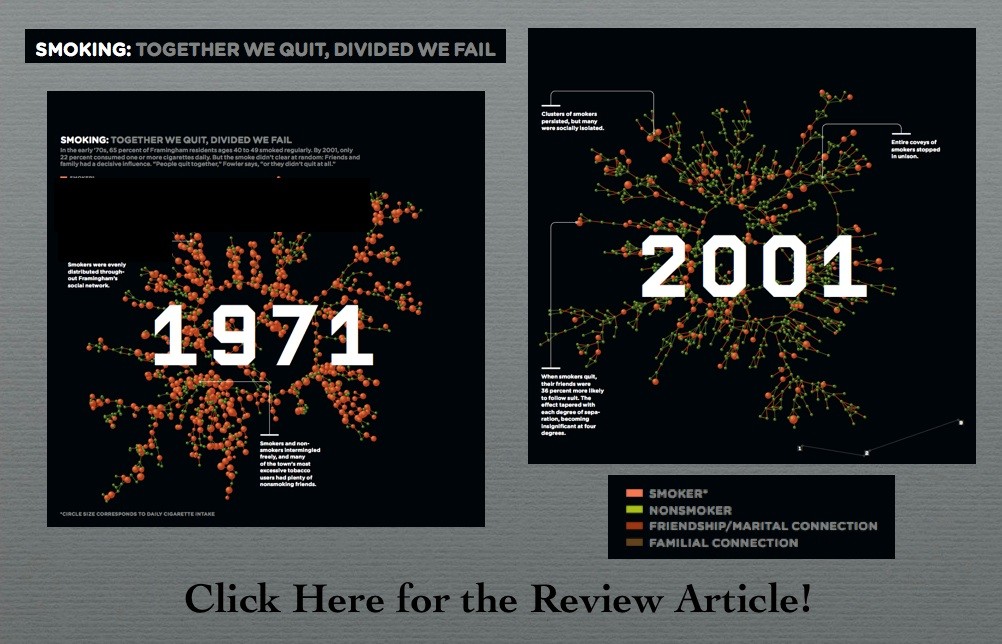
Christakis and Fowler in Wired Magazine
Today marks the official release of Connected: The Surprising Power of Our Social Networks and How They Shape Our Lives by Nicholas A. Christakis & James H. Fowler. There has been some really good publicity for the book including the cover story in last Sunday’s New York Times Magazine. However, given the crisp visualizations — my favorite is the above article from Wired Magazine. Click on the visual above to read the article!
Workshop on Information in Networks ( WIN @ NYU Stern)
Finished the First Day of the Two Day Workshop on Information in Networks. This has been a really great conference thus far. Both the speakers and the participants in the poster session have all offered very high quality work. We were very happy to be able to participate!

