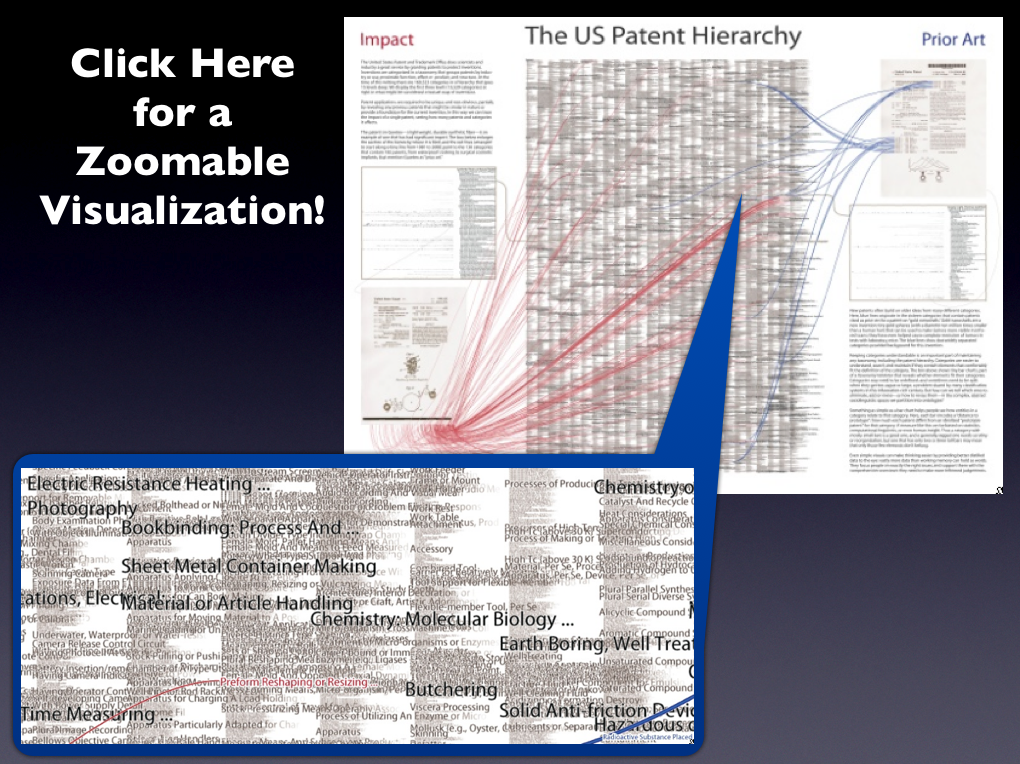
The United States Patent and Trademark Office patent classification scheme organizes 3 million patents into about 160,000 distinct patent classes. This visualization by Katy Börner, Elisha Hardy, Bruce W. Herr II, Todd M. Holloway, & W. Bradford Paley considers the organizational schema used to classify patents at the US Patent Office. Their article Taxonomy Visualization in Support of the Semi-Automatic Validation and Optimization of Organizational Schemas was published in the Journal of Informetrics in 2007.
From the Abstract: “The taxonomy visualization and validation (TV) tool introduced in this paper supports the semi-automatic validation and optimization of organizational schemas such as file directories, classification hierarchies, taxonomies, or other structures imposed on a data set for organization, access, and naming. By showing the “goodness of fit” for a schema and the potentially millions of entities it organizes, the TV tool eases the identification and reclassification of misclassified information entities, the identification of classes that grow too large, the evaluation of the size and homogeneity of existing classes, the examination of the “well-formedness” of an organizational schema, and more.”

