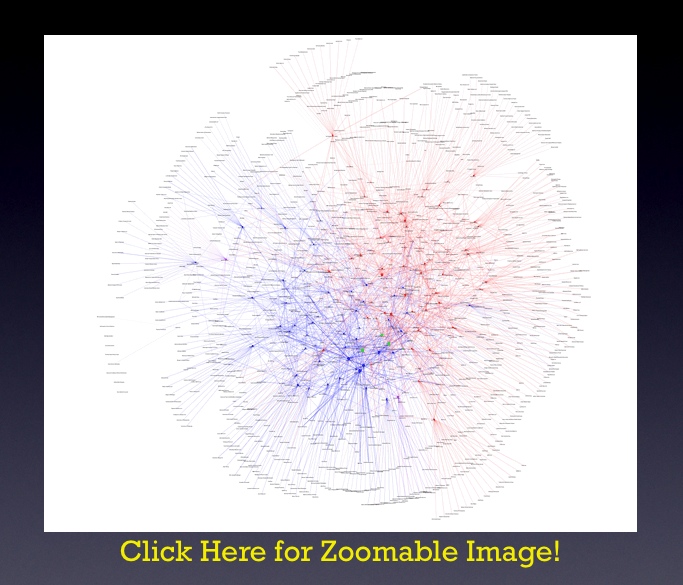
This is a repost our previous Senators of the 110th Congress Campaign Finance Visualization. Last week we highlighted one specific element of the graph (i.e. Senator Dodd and the TARP Banks). Now, we wanted to bring the full graph back to the front of the page for your consideration. Here is the content of the old post with a few small additions….
“As part of our commitment to provide original content, we offer a Computational Legal Studies approach to the study of the current campaign finance environment. If you click below you can zoom in and read the labels on the institutions and the senators. The visualization memorializes contributions to the members of the 110th Congress (2007 -2009). Highlighted in green are the primary recipients of the TARP.
In the post below, we offer detailed documentation of this visualization. One Important Point the Visualization Algorithm we use does force the red team, blue team separation. Rather, the behavior of firms and senators produces the separation.
Four Important Principles: (1) Squares (i.e. Institutions) introduce money into the system and Circles (i.e. Senators) receive money (2) Both Institutions and Senators are sized by dollars contributed or dollars received– Larger = More Money (3) Senators are colored by Party. (4) The TARP Banks are colored in Green. “

