Tag: industries
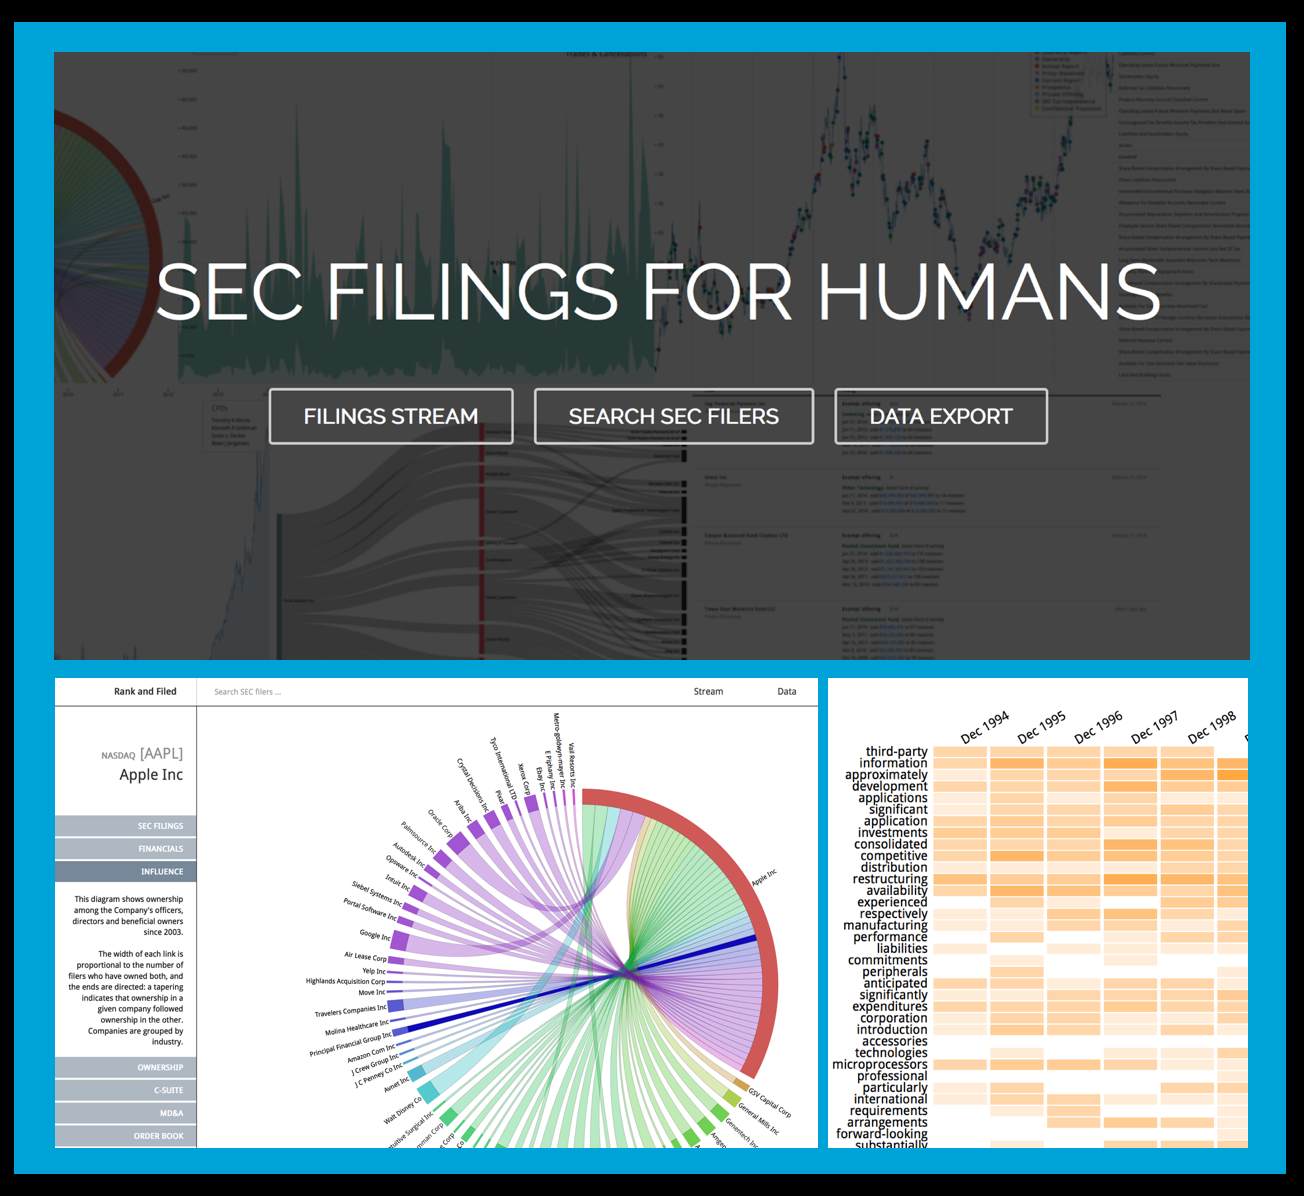
Rank and Filed – SEC Filings for Humans
 Really Impressive Work! – Read More Here. (HT to Ted Sichelman)

Legal Futures Conference – London @ The Royal Bank of Scotland – Nov. 19, 2012
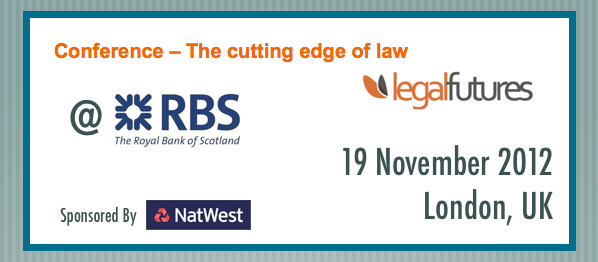
On Monday, I will be speaking at the Legal Futures Conference at the Royal Bank of Scotland Offices in Central London. The topic is the “Cutting Edge of Law” and all of respective speakers can lay claim to that title (in one form or another). Thus, I am looking forward to an exciting day centered around the future of the legal services industry. Congrats to Neil Rose from The Guardian for organizing such a fantastic lineup!
The Rise of Legal Analytics [via BBJ]
HT: Bill Henderson @ The Legal Whiteboard.
In this vein, watch for my new paper “Quantitative Legal Prediction” (Forthcoming to SSRN Soon and to be Published in Emory Law Journal in 2013)