How Long is the Coastline of the Law: Additional Thoughts on the Fractal Nature of Legal Systems

Fractal Nature of Legal Systems

Do legal systems have physical properties? Considered in the aggregate, do the distinctions upon distinctions developed by common law judges self-organize in a manner that can be said to have definable physical property (at least at a broad level of abstraction)? The answer might lie in fractal geometry.

Fractal geometry was developed in a set of classic papers by mathematician Benoît Mandelbrot. The original paper in the field How Long is the Coastline of Britain describes the coastline measurement problem.  In short form, the length of the coast line is a function of the size of measurement one employs.  As shown below, as the unit of measurement decreases the length of the coastline increases.  The ideas expressed in this and subsequent papers have been applied to a wide class of substantive questions. In particular, the application to economic systems has been particularly illuminating. Given recent economic events, we agree with views of the Everyday Economist arguing the applied economic theory built upon his work should earn Mandelbrot a share of the Nobel Prize.
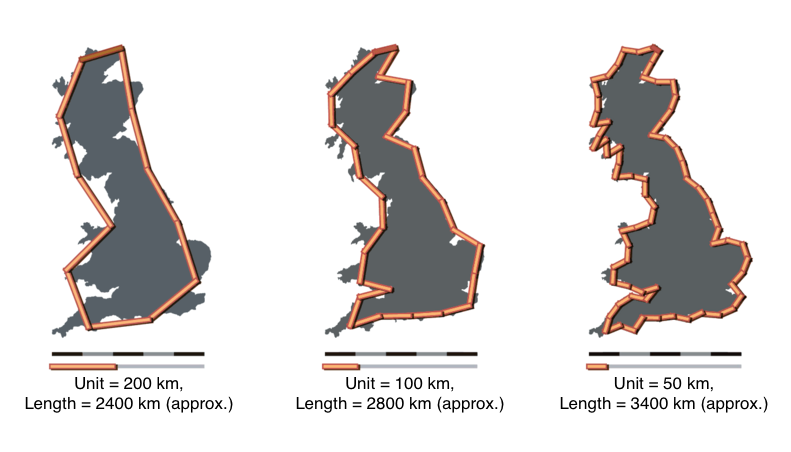
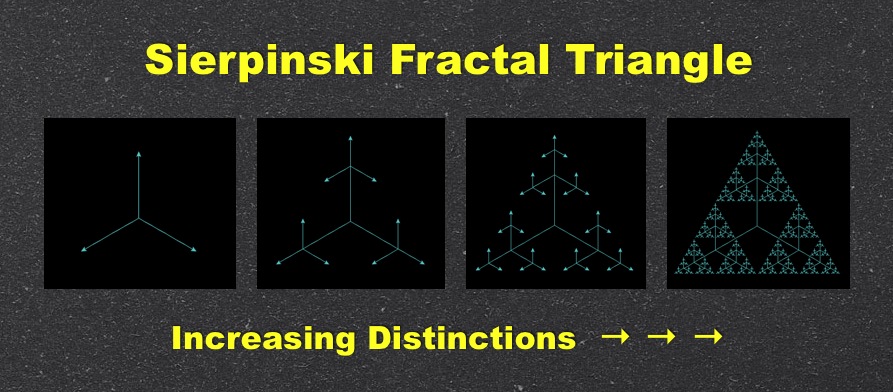
Coastline of BritainA more abstract fractal is the simple version of the Sierpinski triangle displayed at the top of this post. Here, there exists self similarity at all levels. Specifically, at each iteration of the model, the triangles at the tip of each of the lines replicate into self similar versions of the original triangle. If you click on the visual above, you can run the applet (provided you have java installed on your computer). {Side note: those of you NKS Wolfram fans out there will know the Sierpinski triangle can be generated using cellular automata Rule 90.}

For those who are interested in another demonstration consider the Koch Snowflake — a fractal which also offers a view of the relevant properties.  The Koch Snowflake is a curve with infinite length (i.e. there is no convergence even though it is located in a bounded region around the original triangle).  Click here to view an online demo of the Koch Snowflake.

So, you might be wondering … what is the law analog to fractals? As a first-order description of one important dynamic of the common law, we believe significant progress can be made by considering the conditions under which legal systems behave in a manner similar to fractals. For those interested, a number of important papers have discussed the fractal nature of legal systems.  While discussing legal argumentation, the original idea is outlined in two important early papers The Crystalline Structure of Legal Thought and  The Promise of Legal Semiotics both by Jack Balkin.  The empirical case began more than ten years ago in the important paper How Long is the Coastline of the Law? Thoughts on the Fractal Nature of Legal Systems by David G. Post & Michael B. Eisen. It continues in more recent scholarship such as The Web of the Law by Thomas Smith.

In our view, the utility of this research is not to adjudicate the common law to be a fractal. Indeed, there exist mechanisms which likely prevent legal systems from actually behaving as unbounded fractal.  The purpose of the discussion is determine whether describing law as a fractal is a reasonable first-order description of at least one dynamic within this complex adaptive system. While full adjudication of these questions is still an area of active research, we highlight these ideas for their important potential contribution to positive legal theory.

One thing we want to flag is the important relationship between the power law distributions we discussed in these prior posts (here and here) and the original work of  Benoît Mandelbrot. The mapping of the power law like properties displayed by the common law and its constitutive institutions is part of the larger empirical case for the fractal nature of legal systems. Building upon the prior work, in two recent papers, which are available on SSRN here and here, we mapped this property of self organization among two sets of legal elites — judges and law professors.

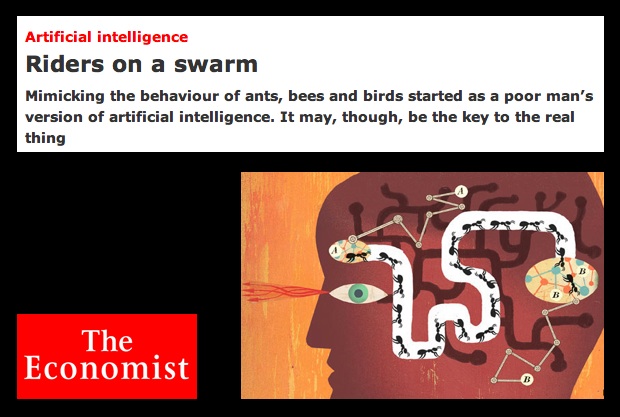
Riders on a Swarm — Might Mimicking the Behavior of Ants, Bees & Birds Be the Key to Artificial Intelligence?

This week’s issue of the Economist has an interesting article entitled Riders on a Swarm. Among other things, the article discusses how attempts to computationally model ant, bee and bird behavior have offered insight into major problems in artificial intelligence.

For those not familiar, the examples discussed within the article are classic models in the science of complex systems. For example, here is the Netlogo implementation of bird flocking. It will run in your browser but requires Java 4.1 or higher. If you decide to take a look — please click setup – then go to make the model run. Once inside the Netlogo GUI, you can explore how various parameter configurations impact the model’s outcomes.

One of the major insights of the bird flocking model is how random starting conditions and local behavioral rules can lead to the emergence of observed behavioral patterns that appear (at least on first glance) to be orchestrated by some sort of top down command structure.

This is, of course, not the case. The model is bottom up and not top down. Both the simplicity and the bottom up flavor of the model are apparent when you explore the model’s code. For those interested, I will take a second and plug the slides from my ICPSR class. In the class, I dedicated about an hour of class time to bird flocking model. Click here for the slides. In the slides, I walk through some of the important features of the code (discussion starts on slide 16).

The Dissemination of Culture — Axelrod (1997) Model — Now Available on Netlogo’s Community Models Page

Robert Axelrod’s 1997 Culture Model is a complex systems classic.  Several versions of the model are available including one in Repast J. Perhaps the most user friendly version has recently been posted to Netlogo’s “community models” page. Those interested in experimenting with this Netlogo version of the model can click on the image above (provided you have Java 4.1 or higher installed).

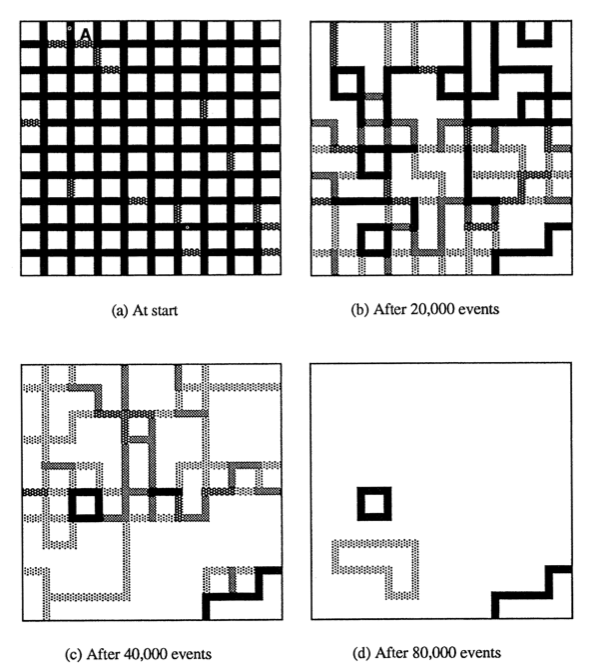
For those not previously familiar with the model … Figure 1 from the article is featured to the left and demonstrates a model run through 80,000 events.  Those results are generated in the following manner:

“Patches are assigned a list of num-features integers which can each take on one of num-traits values. Each tag is called a feature, while it’s value is called the trait. The links in the view represent walls between patches where solid black walls mean there is no cultural similarity, and white walls mean the neighbors have the same culture.

The order of actions is as follows:
1) At random, pick a site to be active, and pick one of it’s neighbors
2) With probability equal to their cultural similarity, these sites interact. The active site replaces one of the features on which they differ (if any) with the corresponding trait of the neighbor.”

Those looking for the original article … here is the both the citation and a link: Robert Axelrod, The Dissemination of Culture: A Model with Local Convergence and Global Polarization, J. Conflict Res, 41, 203 (1997).

In the years following its release, several important extensions or applications have been offered. These include contributions from scholars in a wide number of disciplines including applied math, political science, economics and physics. Indeed, while many more articles are available in outlets such as the arXiv … here is a subset for your consideration ….

Damon Centola, Juan Carlos González-Avella, Víctor M. Eguíluz & Maxi San Miguel, Homophily, Cultural Drift and the Co-Evolution of Cultural Groups, J. Conflict Res. 51, 905 (2007).

Konstantin Klemm, Victor M. Eguíluz, Raul Toral, Maxi San Miguel, Globalization, Polarization and Cultural Drift, J. Economic Dynamics & Control 29, 321 (2005).

Konstantin Klemm, Victor M. Eguíluz, Raul Toral & Maxi San Miguel, Role of Dimensionality in Axelrod’s Model for the Dissemination of Culture, Physica A 327, 1 (2003).

Forest Fire Model-A Popular Example of Non-Linearity [Repost from 5/13]

Forest Fire Model

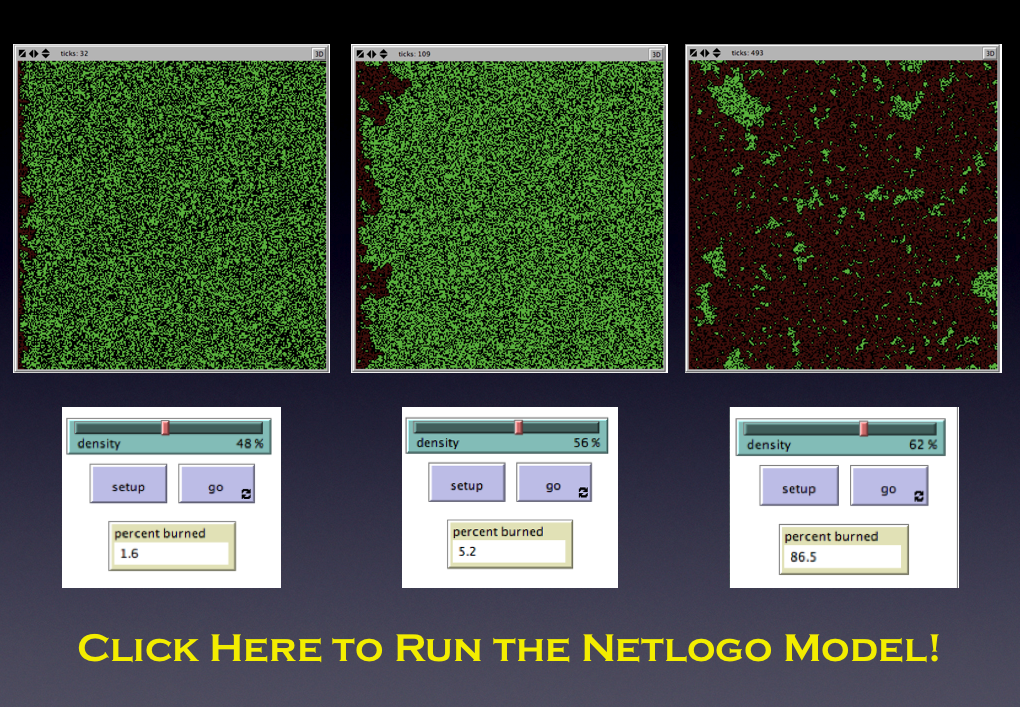
The Forest Fire Model is a commonly invoked example of non-linear system–where a very small perturbation can generate significant differences in observed outcomes. Consider the above Netlogo–to Run the Model: (1) Adjust the Density Slider to set the concentration within the Forest.  (2) Hit the Setup Button (3) Hit the Go Button  …. Rinse and Repeat at different levels of Density.

Above is the output for a run of the model at several levels of Density {48%, 56%, 62%}.  Notice the differences in the Percent Burned {1.6%, 5.2%, 86.5%}.

This is obviously a theoretical model but it has potential application to a wide class of substantive questions including regulatory failure.  In addition, the Forest Fire Model is important because it has been invoked in the critique of the popular book The Tipping Point. Specifically, in discussing the book network scientist Duncan Watts notes “It sort of sounds cool … But it’s wonderfully persuasive only for as long as you don’t think about it.” Watts notes “…trends are more like forest fires: There are thousands a year, but only a few become roaring monsters. That’s because in those rare situations, the landscape was ripe: sparse rain, dry woods, badly equipped fire departments. If these conditions exist, any old match will do…. and nobody… will go around talking about the exceptional properties of the spark that started the fire.” (Quotes from Jan 2008 Is the Tipping Point Toast? Fast Company Magazine).

The S.I.R. Model — A Simple Model With Applications to Swine Flu, etc.


Virus on a Network

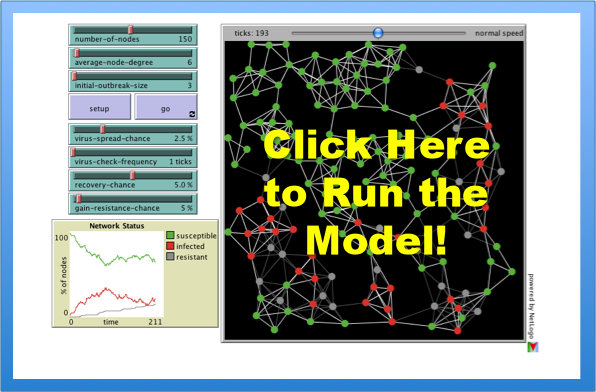
Last week we offered a model of intellectual diffusion built upon a standard fare social epidemiology model.  Given recent events within the United States, Mexico and potentially worldwide, we thought it would be worthwhile to highlight the classic S.I.R. (Susceptible, Infected, Recovered) model.  Netlogo offers a user friendly version of the model.  Using this platform, we hope the exploration of the dynamics of S.I.R. might prove illuminating.    

First, various hosts have different levels of interactions (work, home, transit, etc.) and so this network approach represents a blunt measure.   To start the model at the default parameters, push the SETUP Button and then the GO Button.  As the model runs, the plot tracks the Susceptible, Infected, Recovered.  The model contains a variety of  “sliders.”  The model can be rerun at lots of combinations of parameter levels.  Those “sliders” fall into several categories: Network Attributes, Virus Attributes, Node Attributes.   The full documentation is available here.  

With respect to the swine flu, one important parameter is the delay between when an individual becomes infectious and when that individual is likely to become symptomatic.  This parameter can be tuned in the simulation above using VIRUS-CHECK-FREQUENCY slider.  From the documentation… “Infected nodes are not immediately aware that they are infected. Only every so often (determined by the VIRUS-CHECK-FREQUENCY slider) do the nodes check whether they are infected by a virus.”  

An additional parameter worthy of consideration is the VIRUS-SPREAD-CHANCE.  Consider this slider as a rough measure of the underlying infectiousness of the virus in question.        

It is important to note the above simulation is an incredible simplification of the world faced by public health officials.  Additionally, this version of the model was designed to consider the spread of disease on a computer network.  Notwithstanding these limitations, we thought it useful to highlight a computational approach to this important matter of public concern.

Classic Model from Complex Systems: The El Farol Bar Problem

picture-31

I recently attended a conference at the Santa Fe Institute.  During the trip, I made a point of eating at the El Farol Bar & Restaurant. This restaurant holds a special place in the lore of complex systems.  Thus, I thought I would take the opportunity to highlight the model on the CLS blog.  

Here is a subset of the model description…. “The bar is popular — especially on Thursday nights when they offer Irish music — but sometimes becomes overcrowded and unpleasant. In fact, if the patrons of the bar think it will be overcrowded they stay home; otherwise they go enjoy themselves at El Farol. This model explores what happens to the overall attendance at the bar on these popular Thursday evenings, as the patrons use different strategies for determining how crowded they think the bar will be.”   

The original paper written by Brian Arthur is located here. An interesting follow up paper employing reinforcement learning is located here.    This above is a screen print from the Netlogo model.  Netlogo offers an easy interface useful for exploring a variety of agent based models.  

The model will run in your browser provided you have Java 1.4.1+.  

To run the El Farol model, please go here.   

Coming Next Week on CLS Blog

picture-4


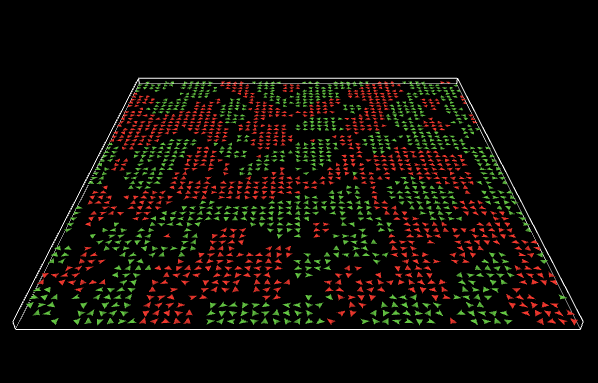
A Netlogo 3D screenprint of one of the classic agent based models—the Shelling Segregation Model is above. We offer it as a holdover until CLS Blog Returns Sunday Night with more exciting content…..

NEXT WEEK:
(1) Discussion of a New Paper: Computer Programming and the Law
(2) Visualizing the 110th Congress — The House of Representatives
(3) For Law Students and Law Professors — Data on the Law Clerk Tournament
(4) And More …..