Visualizing Contributions to the 110th Congress — The House Edition


picture-41


DOCUMENTATION FOR THE VISUALIZATION

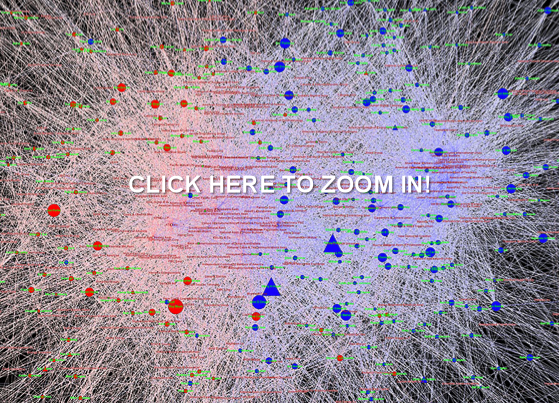
Visualizing the Campaign Contributions to the Representatives of the 110th Congress —
The House Edition

University of Michigan
Center for the Study of Complex Systems
Department of Political Science

BASIC OVERVIEW:

110th Congress = January 3, 2007 – January 3, 2009

435 Voting Members of the United States House of Representatives + District of Columbia (Eleanor Holmes Norton) + Puerto Rico (Luis Fortuno) +  Virgin Islands (Donna Christian-Green) + American Samoa (Eni F H Faleomavega) + Guam (Madeleine Z Bordallo)

Click here and here for the Senators of the 110th Congress.

BASIC RULE:

Squares (Institutions) Introduce Money into the System and Circles (Congressmen) Receive Money.


DATA OVERVIEW:

Using recently published data on campaign contributions collected by the Federal Election Commission and aggregated by the Center for Responsive Politics our visualizations track large money donations to members of the 110th Congress over the 2007 – 2008 window.

It is important to note that most of these organizations did not directly donate. Rather, as noted by the Center for Responsive Politics “the money came from the organization’s PAC, its individual members or employees or owners, and those individuals’ immediate families. Organization totals include subsidiaries and affiliates. Of course, it is impossible to know either the economic interest that made each individual contribution possible or the motivation for each individual giver. However, the patterns of contributions provide critical information for voters, researchers and others.”

The Center describes its methodology here http://www.opensecrets.org/politicians/method_pop.php.

To provide for an optically tractable view of the top contributions, we follow the CRP and impose the limiting requirement that to be included in our tally a given group’s contribution must fall within a given house members top contributor list.

We try to strike a tradeoff between information overload and incomplete disclosure.

In coming days, we will provide an additional visualization of the underlying data.  Check back soon!


CONTRIBUTORS & CONTRIBUTIONS:

2,508 of the Donors are captured in the Graph.

Total Recorded Donations Introduced into our Visualization by these Entities Total to  $113,134,698


(1) SIZING of the REPRESENTATIVE NODES — Each Circular node representing a Member of the House is sized according the amount of incoming donations. Thus, larger nodes are the recipients of larger sums of money while the smaller nodes received smaller amounts of money.

pic11


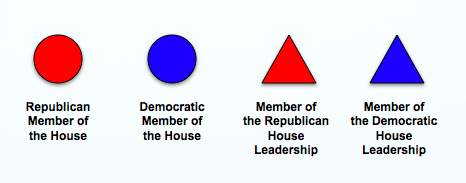
(2) COLORING and SHAPES of the REPRESENTATIVE NODES — Each node representing a Member of the United States House of Representatives is colored according their Political Party. Using popular convention, we color members of the Republican Party as Red and members of the Democratic Party as Blue.
picture-16


(3) SIZING of the CONNECTIONS — Each Connection (Arc) between an Institution and a Member of the House is sized according to the amount of money flowing through a connection. Darker connections represent larger flows of money while lighter connections represent smaller amounts of money.

pic5


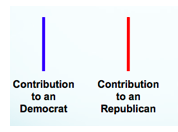
(4) COLORING of the CONNECTIONS — Each connection representing a campaign contribution from an entity to a member of Congress is colored according to partisan affiliation of the receiving representatives. Using popular convention, we color members of the Republican Party as Red and members of the Democratic Party as Blue.
picture-23


(5) STRUCTURE OF THE GRAPH The Graph is Visualized Using Fruchterman-Reingold. This is an automated spring embedded, force directed placement algorithm often used in the network science literature to visualize graphs of this size.


(6) ACKNOWLEDGEMENTS We thank Rick RioloJon ZelnerCarl Simon, Scott Page and the Center for Responsive Politics for their comments, contributions and/or data.

Classic Model from Complex Systems: The El Farol Bar Problem

picture-31

I recently attended a conference at the Santa Fe Institute.  During the trip, I made a point of eating at the El Farol Bar & Restaurant. This restaurant holds a special place in the lore of complex systems.  Thus, I thought I would take the opportunity to highlight the model on the CLS blog.  

Here is a subset of the model description…. “The bar is popular — especially on Thursday nights when they offer Irish music — but sometimes becomes overcrowded and unpleasant. In fact, if the patrons of the bar think it will be overcrowded they stay home; otherwise they go enjoy themselves at El Farol. This model explores what happens to the overall attendance at the bar on these popular Thursday evenings, as the patrons use different strategies for determining how crowded they think the bar will be.”   

The original paper written by Brian Arthur is located here. An interesting follow up paper employing reinforcement learning is located here.    This above is a screen print from the Netlogo model.  Netlogo offers an easy interface useful for exploring a variety of agent based models.  

The model will run in your browser provided you have Java 1.4.1+.  

To run the El Farol model, please go here.   

April as the Cruellest Month? Data on the Law Clerkship Tournament


picture-13


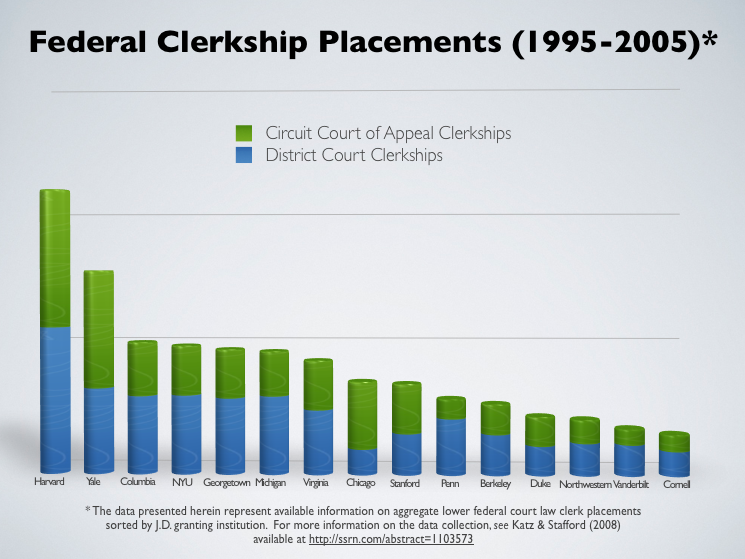
Judge Wald’s classic article describing the market for judicial clerks reminds us how April was once the cruellest month.  Given the Federal Law Clerk Hiring plan has shifted the relevant window of discomfort, we thought it reasonable to ring in the spring season with some of our data on the law clerk tournament.  Using underlying information Derek Stafford and I collected for our article Hustle and Flow: A Social Network Analysis of the American Federal Judiciary, here is Federal Court Clerkship data for the period of the “Natural” Rehnquist Court.  The current offering is aimed at the US News Top 15 Law Schools.  Although this data terminates in the 2004- 2005 clerkship year, we still believe it offers useful empirical insight into the status of the law clerk tournament. 

Computer Programming and the Law — OR — How I Learned to Learn Live with Python and Leverage Developments in Information Science


picture-31


One of our very first posts highlighted a recent article in Science Magazine describing the possibilities of and perils associated with a computational revolution in the social sciences.  A very timely article by Paul Ohm (UC-Boulder Law School) entitled Computer Programming and the Law: A New Research Agenda represents the legal studies analog the science magazine article.  From information retrieval to analysis to visualization, we believe this article outlines the Computational Legal Studies playbook in a very accessable manner.

Prior to founding this blog, we had little doubt that developments in informatics and the science associated with Web 2.0 would benefit the production of a wide class of theoretical and empirical legal scholarship. In order to lower the costs to collective action and generate a forum for interested scholars, we believed it would be useful to produce the Computational Legal Studies Blog. The early results have been very satisfying. For example, it has helped us link to the work of Paul Ohm.  

For those interested in learning more about not only the potential benefits of a computational revolution in legal science but also some of the relevant mechanics, we strongly suggest you consider giving his new article a read!  

Coming Next Week on CLS Blog

picture-4


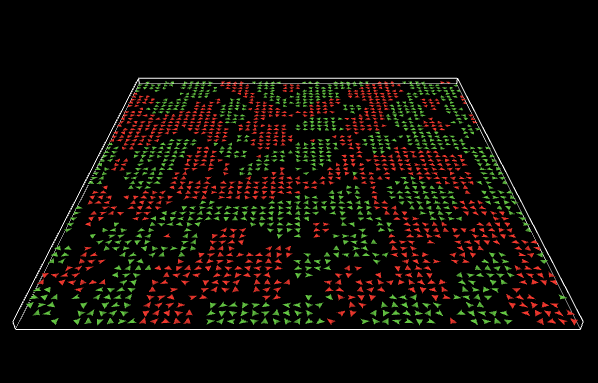
A Netlogo 3D screenprint of one of the classic agent based models—the Shelling Segregation Model is above. We offer it as a holdover until CLS Blog Returns Sunday Night with more exciting content…..

NEXT WEEK:
(1) Discussion of a New Paper: Computer Programming and the Law
(2) Visualizing the 110th Congress — The House of Representatives
(3) For Law Students and Law Professors — Data on the Law Clerk Tournament
(4) And More …..

With Bankruptcy on Our Minds: The Structure of Title 11 U.S.C.


CLICK ON IT AND YOU CAN ZOOM IN and READ EVERY LABEL!

MOTIVATION:

We have become interesting in visualizing the structure of the law including its components and subcomponents.  In reduced form, statutes, regulations and certain other units of the law can be characterized in graph theoretical terms.  While we do not make deep inroads on the content of this above graph, we do generate a tree traversable visualization for its structure.

Much of my training in law school (particularly in the so called “code-based” classes) was focused upon developing mental models for the structure and content of graphs such as the one displayed above. In my case, I believe the usage of such a visualization early in a code-based course would have been beneficial. Thus, we offer this traversable visualization to the world for not only its research value but also for pedagogical purposes.

INSTRUCTIONS:

Start in the MIDDLE at the “11 U.S.C.__ ” Label and traverse out.

BREAKDOWN OF THE VISUAL:
GREEN NODE LABELS =   for SECTIONS  {In the Example below, 11 U.S.C. § 101}
YELLOW ARCS — Chapter 7 of Title 11 = LIQUIDATION
BLUE ARCS — Chapter 11 of Title 11 = REORGANIZATION  (aka “Filing Chapter 11“)
RED ARCS and GREY ARCS — Balance of the Chapters under Title 11
Red Arcs are for lines which lead to terminal nodes
Grey Arcs are for lines which do not immediately lead to terminal nodes


picture-1

FINAL THOUGHTS:
Please feel free to PLAY AROUND and TEST IT OUT!
This is an early production version so please provide us with any feedback and/or suggestions.